山寨季通常什么时候来?分析总结350个山寨币对BTC的汇率走势


背景
最近,BTC的市值占比达到了2年来的高点,这引起了我们去分析BTC外的山寨币对BTC的汇率。首先,让我们观察一些主流币对btc的交易对在历史的k线走势。
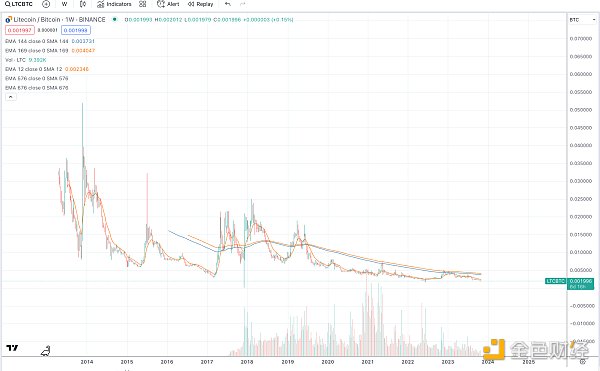
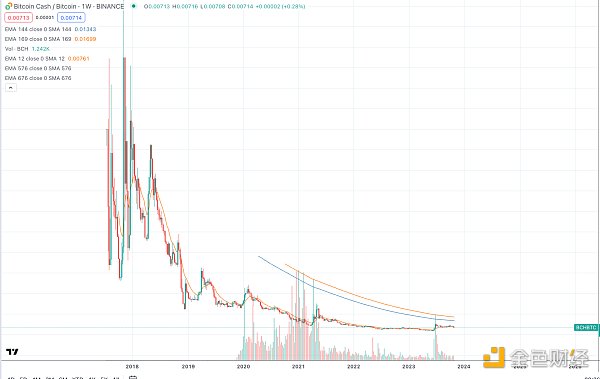
下为TradingView中,一些过去多年间主流币种对BTC的汇率
LTC/BTC
BCH/BTC
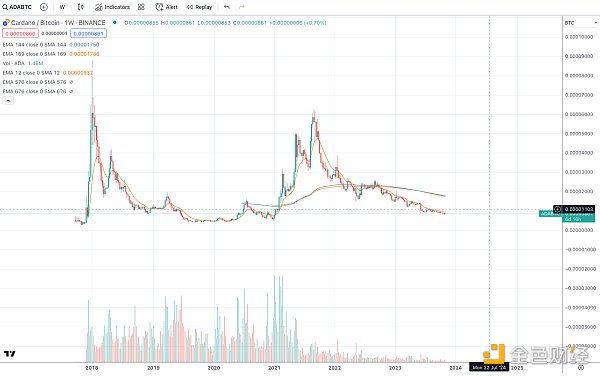
ADA/BTC
ETH/BTC
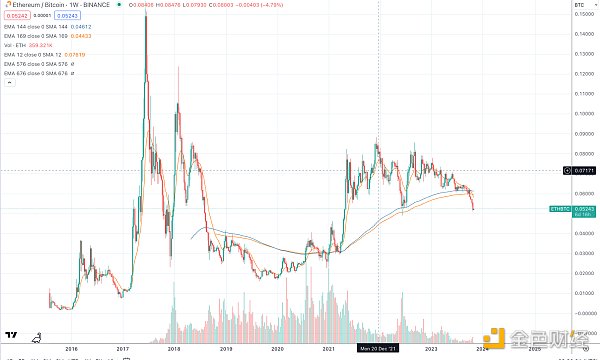
从上面的图表中,我们发现即使表现最好的代币如ETH也仅仅是在其推出后约2年的2017年达到了对BTC的汇率历史最高值, 再此后ETH/BTC的汇率并没有超越前高。
因此,我们决定扩大分析的范围:分析所有山寨币与BTC的历史汇率变化。
方法
从CoinMarketCap中选择市值最高的500种硬币
从gate.io获取这些代币的周线价格(gate拥有大多数代币的最长的历史价格)
找出所有代币相对于BTC的所有时间最高汇率和日期
计算从交易开始日期到btc汇率最高点的日期
计算btc汇率最低点到当前日期的时间
计算今天的汇率 / 所有时间最高点
此方法已在GitHub上开源(文末有github链接)
没有涉及复杂的统计。在未来,我们可以采用更多的统计模型进行分析。
发现
最终被统计的代币范围
一些前500的代币在Gate.io上并未进行交易,同时我们排除了交易时间<1年的代币。最后,我们分析了大约350个代币,涵盖了大部分主流代币。
指标
排除交易时间<1年的代币
使用altcoin和比特币的周线高价对比来计算汇率
代币对BTC汇率的历史最高价格(All-Time-High, ATH)通常何时出现?
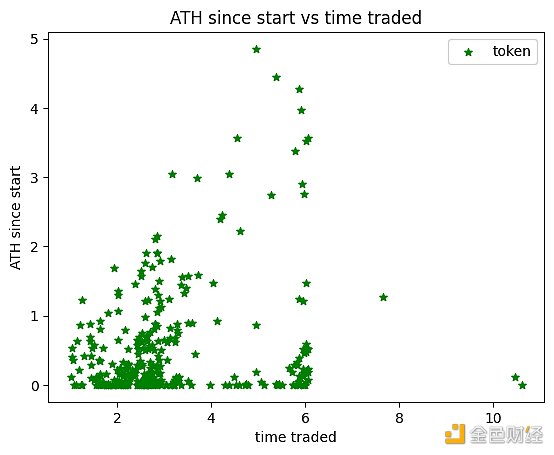
Y轴表示自代币发行以来达到历史最高价格(ATH)的时间跨度(以年为单位)。
X轴表示代币已经交易的年数。
从图表中,我们可以找到ATH时间的分布。
大部分的代币在交易的第一年内达到他们对BTC汇率的ATH
很少有代币在2年后达到他们的ATH
让我们通过饼图来更好地观察
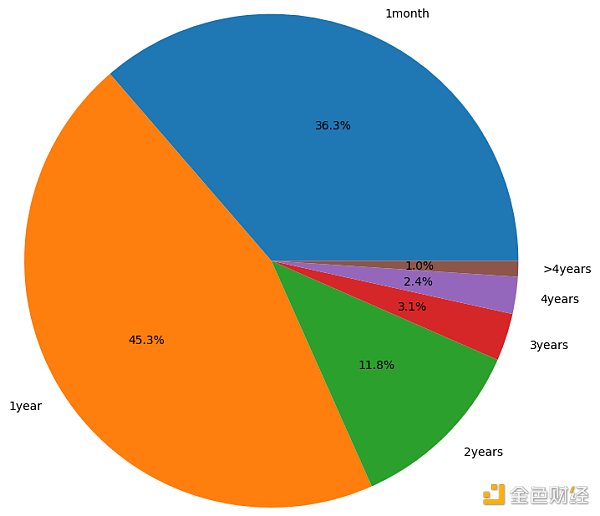
图表:自交易开始日期以来的ATH分布
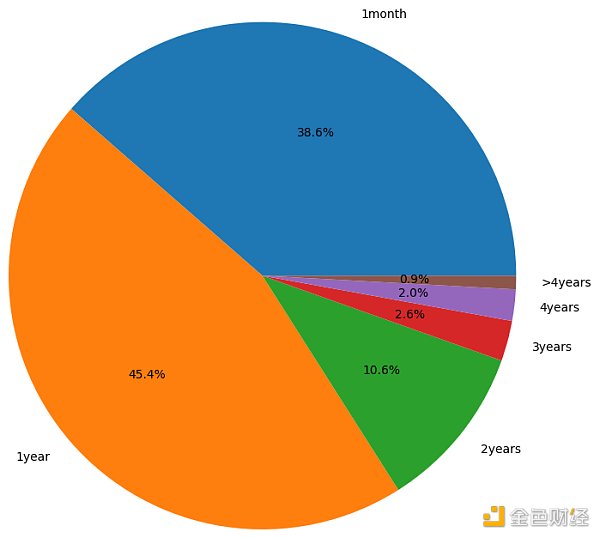
从上面的图表中,我们可以观察到:
只有5.5%的代币在发布后2年达到了对BTC的ATH,剩下的代币均在交易开始后的2年内达到ATH
为了更好地观察结果,我们需要筛选出交易时间<2年的代币。
一旦我们移除了交易时间<2年的代币,我们还剩下大约289个代币。
图表:自开始日期以来的ATH分布,排除了交易超过2年的代币
结果并没有多大变化,只有6.6%的代币在两年后达到了对BTC的ATH。
让我们深入研究这些代币:['BNB','DOGE','ETC','FIL','FRAX','FTM','GT','LEO','LINK','MANA','MATIC','OKB','ONE','TFUEL','THETA','TON','TUSD','VET','WAVES']
在19个代币中,由于Gate的上币延迟,有些可能被错误地包含在内。平均交易长度为4.82年,即2019-01-09,当时BTC的交易价格约为3500美元,此时为上一次熊市的底部。
山寨币的历史最低点(All-Time-LOW, ATL)通常何时发生?
在上一部分中,我们分析了山寨币的最高汇率何时发生,现在让我们探讨一下山寨币的历史最低汇率何时发生。
指标
排除交易时间 < 1年的代币
使用altcoin和比特币的周低值来计算汇率
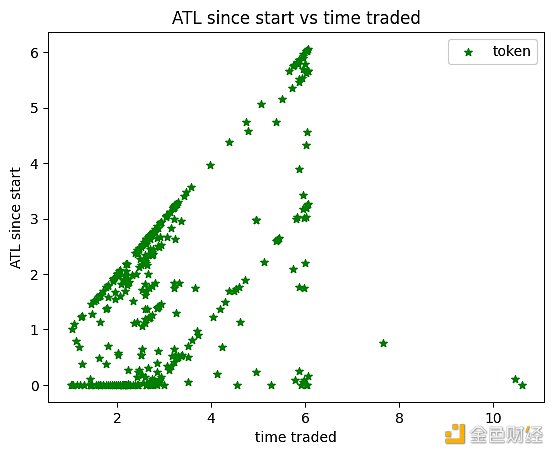
这个图表更为有趣,这个图显示了altcoin/btc汇率ATL几乎与交易时间成线性关系,即交易时间越长,越大概率对BTC的汇率处于ATL。让我们通过饼状图找出更多信息!
由于ATL对于交易时间超过4年的代币更有意义。我们只包括交易时间超过4年的代币。
图表:从当前日期开始,交易超过4年的代币的ATL的分布
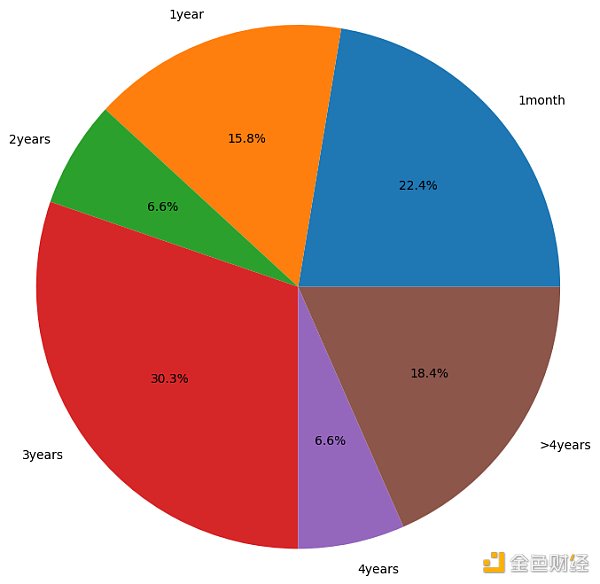
因此,只有18.4%的代币交易时间超过4年的代币在最后一个周期中未达到与BTC汇率的最低点。让我们深入研究这些代币:
他们是['ADA','DASH','DOGE','ETH','GT','KNC','LINK','LTC','MANA','MKR','SNT','THETA','TRX','VET']. 这些标记的代币意味着他们在对BTC汇率上并不比上一周期表现更差差。如果我们去掉两个特殊的老代币ETH和LTC,剩下代币平均交易长度为5.77年,彼时是2018-01-25,也就是上一次熊市的结束的时间,以及发币日期和ATL之间的时间差大约是0.35,这将他们的ATL定在大约2018-06-05。
结论
在我们分析的350个代币中,只有19个代币在上一个周期中对比BTC汇率创下了新的历史最高价格
它们是:
['BNB','DOGE','ETC','FIL','FRAX','FTM','GT','LEO','LINK','MANA','MATIC','OKB','ONE','TFUEL','THETA','TON','TUSD','VET','WAVES']它们大约在2019年3月上所,即上一个熊市的底部
在上一个周期中,350个代币中只有14个代币对BTC没有创造新的ATL:
它们是
['ADA','DASH','DOGE','ETH','GT','KNC','LINK','LTC','MANA','MKR','SNT','THETA','TRX','VET']。它们在上一个牛市结束时推出,并在大约4个月后,即上一个熊市开始时,达到了历史最低价
唯一的重叠是
['DOGE', 'GT', 'LINK', 'MANA', 'THETA', 'VET']因此,抄底极具风险,且大概率不会带来最高的回报
尽量避免购买在上一个牛市期间上所的二级市场代币!
它们中的大多数将继续创造历史最低价
一些代币将在几个月内看到其BTC兑换率的历史最低价,然后在下一个周期回升。但是这种反弹并不多
只有在大熊市期间推出的代币才能创造对BTC的新的ATH,甚至ETH也不行
尽可能将代币在上所后的2年内全部卖出,并在熊市中将其逐步转换为BTC,因为只有6%的代币能在下个周期创造对BTC汇率的新ATH,即比上个周期更加强势。
Background The recent market value ratio has reached a high point in recent years, which has caused us to analyze the exchange rate of foreign counterfeit currency pairs. First, let's observe the exchange rate of some mainstream currency pairs in the historical trend. When does the counterfeit season usually analyze and summarize the exchange rate trend of a counterfeit currency pair? When does the counterfeit season usually analyze and summarize the exchange rate trend of a counterfeit currency pair? When do you usually analyze and summarize the exchange rate trend of a pair of counterfeit coins? From the above chart, we find that even the best-performing tokens have reached the historical highest exchange rate in about years after their launch, and then the exchange rate has not exceeded the previous high. Therefore, we decided to expand the scope of analysis and analyze the historical exchange rate changes of all counterfeit coins, and choose the kind of coins with the highest market value from the weekly price of these tokens and the longest historical price of most tokens. Calculate the highest exchange rate and date of all tokens relative to all times, calculate the lowest exchange rate from the transaction start date to the highest exchange rate, and calculate the highest exchange rate today. This method has been linked at the end of the open source article and does not involve complicated statistics. In the future, we can use more statistical models to analyze and find that some of the former tokens have not been traded in the world, and we exclude the most tokens with transaction time and year. After that, we analyzed about 10 tokens, covering most of the mainstream token indicators, excluding the transaction time, and compared the weekly high price of bitcoin to calculate the historical highest price of exchange rate tokens against the exchange rate. When did the cottage season usually appear? When did we analyze and summarize the exchange rate trend of a cottage coin pair? The axis indicates the time span of reaching the historical highest price since the token was issued, and the axis indicates the number of years in which tokens have been traded. From the chart, we can find most of the time distribution. Some tokens reach their exchange rate within the first year of trading, and few tokens reach their exchange rate after the year. Let's better observe the distribution of the chart since the start date of trading through pie charts. When does the cottage season usually analyze and summarize the exchange rate trend of a cottage currency pair? From the chart above, we can observe that only the tokens reach the right level in the year after the release, and the remaining tokens reach the right level within the year after the start of trading. In order to better observe the results, we need to screen out the trading time year. Tokens Once we remove the tokens with a transaction time of years, we still have about 10 tokens left. The distribution since the start date excludes the tokens that have been traded for more than years. When do you usually analyze and summarize the exchange rate trend of a pair of counterfeit coins in the cottage season? The results have not changed much. Only some tokens have reached the right after two years. Let's study these tokens in depth, and some of them may be wrongly included due to the delay in loading. The average transaction length is years, that is, the transaction price at that time is about the United States. Yuan is the bottom of the last bear market at this time. When did the historical low point of shanzhai coins usually occur in the last part? We analyzed when the highest exchange rate of shanzhai coins occurred. Now let's discuss when the historical low exchange rate of shanzhai coins occurred. Exclude the trading time, the use of tokens in the year and the weekly low value of bitcoin to calculate the exchange rate. When does the shanzhai season usually analyze and summarize the exchange rate trend of a shanzhai coin pair? This chart shows that the exchange rate is almost linearly related to the trading time. That is, the longer the transaction time, the greater the exchange rate of the probability pair. Let's find out more information through the pie chart. Because it is more meaningful for tokens that have been traded for more than one year, we only include the chart of tokens that have been traded for more than one year from the current date. When does the cottage season usually analyze and summarize the exchange rate trend of a cottage currency pair? Therefore, only the tokens that have been traded for more than one year have not reached the lowest point with the exchange rate in the last cycle. Let's further study. If we remove two special old tokens and the remaining tokens, the average transaction length is years, that is, the end time of the last bear market, and the time difference between the date of issuing coins is about, which sets their conclusion at about. In the last cycle, only one token in our analysis hit a new historical highest price compared with the exchange rate, and they are big. In the last cycle, there were only two pairs of tokens that did not create new ones. They were introduced at the end of the last bull market and reached the lowest price in history about months later. The only overlap is that bargain-hunting is extremely risky and will not bring the highest return with high probability. Try to avoid buying the secondary market tokens that were bought during the last bull market. Most of them will continue to create the lowest price in history. Some tokens will be in. See the lowest exchange rate in history in a few months, and then pick up in the next cycle, but this rebound is not much. Only the tokens launched during the big bear market can create new ones, or even not. Try to sell all the tokens in the years after the Shanghai Stock Exchange and gradually convert them into because only the tokens can create new exchange rates in the next cycle, that is, they are stronger than the last cycle. 比特币今日价格行情网_okx交易所app_永续合约_比特币怎么买卖交易_虚拟币交易所平台
注册有任何问题请添加 微信:MVIP619 拉你进入群

打开微信扫一扫
添加客服
进入交流群
1.本站遵循行业规范,任何转载的稿件都会明确标注作者和来源;2.本站的原创文章,请转载时务必注明文章作者和来源,不尊重原创的行为我们将追究责任;3.作者投稿可能会经我们编辑修改或补充。