glassnode:山寨季快来了 资金在轮动


作者:Ding HAN, Alice Kohn 翻译:Glassnode
自去年十月以来,我们的山寨币动能标显示出投资者将资本进一步转移到风险曲线上的意愿在增长。
尽管比特币的主导地位依然显著,但我们已经看到更多资本开始向以太坊、Solana、Polkadot和Cosmos生态系统转移的早期迹象。
通过调查Uniswap流动性池,我们可以看到大部分资本仍然留在最成熟的资产中,尽管总锁定价值(TVL)正在向风险曲线外移动,但交易量的跟随却较为缓慢。
一、预期“山寨币季”
随着新的现货比特币交易所交易基金(ETF)势头增强,数字资产领域的牛市可能已经开始。在这种背景下,我们将继续探讨我们在 第4周链上周报中涵盖的资本是否会流入山寨币的问题。本期将重点关注资产在风险曲线上更远处的表现。
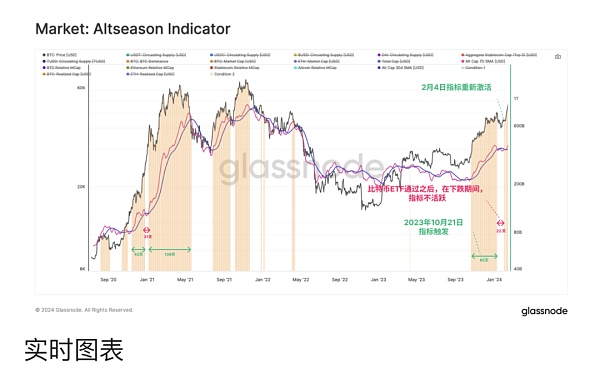
评估资本如何在山寨币市场中轮动和流动的目标。我们将再次使用我们的山寨币指标 作为宏观指标(见 2023年第41周周报).。该指标评估总交易所币市值内是否正在形成积极动能,并伴随着资金持续流入比特币、以太坊和稳定币。
我们的山寨币指标自去年十月以来一直显示出积极的动能,尽管在比特币ETF获批后的“卖出新闻”事件中短暂暂停。它在2月4日重新触发。
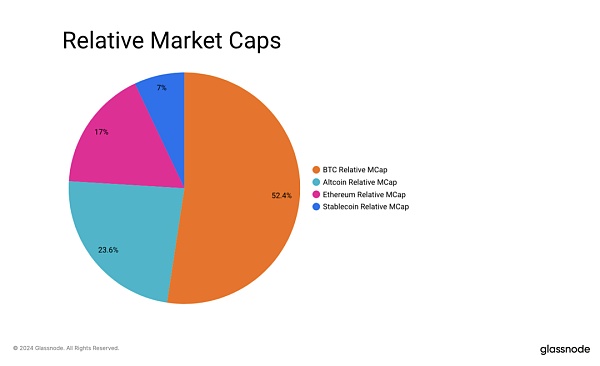
就市值占比而言,比特币以超过52%的市场份额继续领先于整个数字资产市场总市值。相比之下,以太坊占17%,稳定币占7%,其余的山寨币占24%。
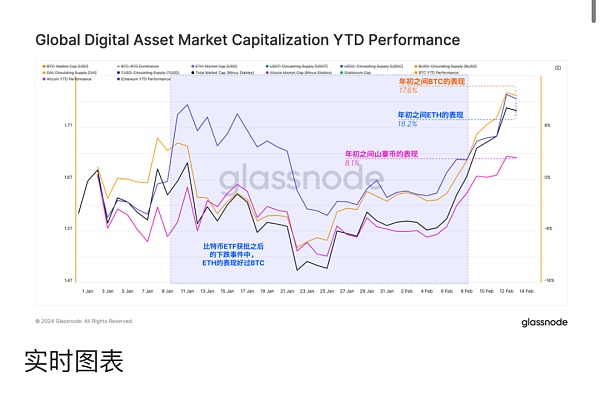
在资产表现方面,BTC和ETH领跑,年初至今(YTD)涨幅分别为+17.6%和+18.2%。我们注意到,在比特币ETF获批后,ETH开始超越BTC,这是自2023年以来相对表现不佳的一个变化。
然而,总体来看,山寨币市值表现不佳,年初至今的增长不到两个主要货币的一半。
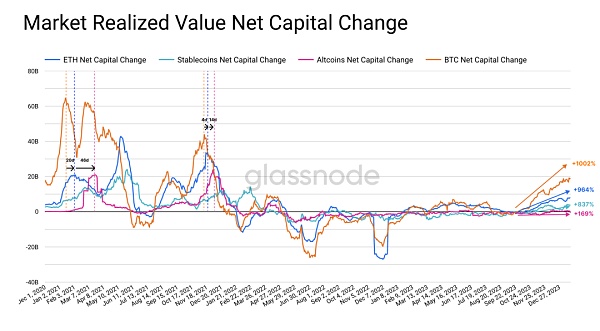
另一个跟踪表现的方法是使用每个行业的实现市值,它汇总了链上转移的所有币种的成本基础价值。从这一单,我们可以更好地评估数字资产市场内资本的流动。
比特币再次明显领先,目前每月几乎有200亿美元的资金流入。
以太坊的资金流入往往相对滞后于比特币,这表明投资者寻求信心和确认数字资产市场正在增长。在2021年周期中,新资本流入BTC的高峰出现在流入ETH高峰的前20天。
山寨币倾向于在ETH显示强劲之后相似的滞后看到资本流动,2021年中期为46天,2021年末为14天。
显然,资本流向山寨币的速度比两大主要加密货币之间的轮换要慢,这一趋势似乎再次上演。
二、行业轮动
随着资本流向两个主要币种的迹象,下一个问题是观察它如何随时间在风险曲线上进一步流动。在上一个周期中,几个新的第一层(Layer-1)生态系统出现了。这些生态系统中的许多不仅在创新和吸引用户方面与以太坊竞争,而且在投资资本方面也是如此。
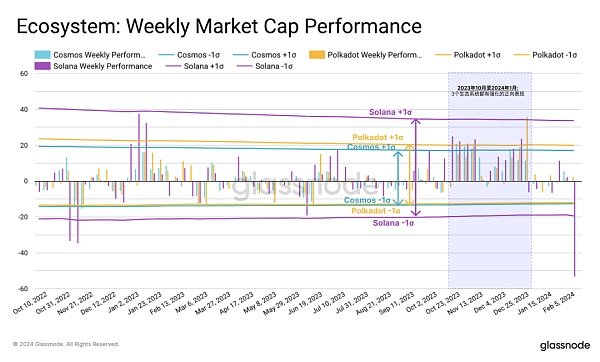
因此,我们检查了一些选定生态系统的前五个代币:以太坊、Cosmos、Polkadot和Solana,以评估哪些吸引了最多的投资者兴趣。
这里我们比较了每个生态系统中前五个代币的总市值的周变化。在过去的18个月中,Solana表现出相对高的波动性,上行表现尤为突出。Polkadot和Cosmos的波动性相似,但Polkadot生态系统表现优于后者。
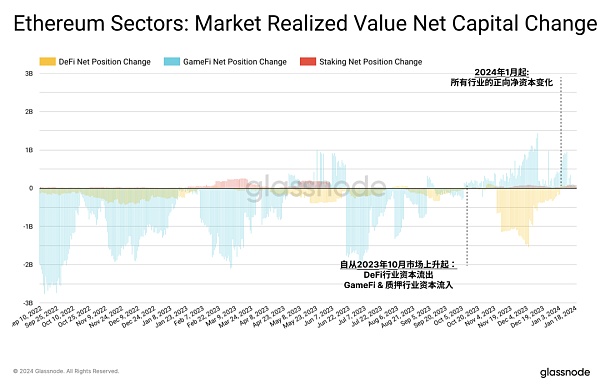
在以太坊生态系统内,我们可以指定三个主要领域:DeFi、GameFi和质押。自今年年初以来,所有三个行业都出现了资金流入,然而DeFi和GameFi行业在2022年和2023年一直存在相对较大的资本流出。
今年GameFi领域出现了逆转,从10月开始显著流入,这与我们的山寨币指标触发的时间点一致。相比之下,质押代币一直经历着正向的资本流入,尽管绝对量较小。
三、在风险曲线上移动
要确定投资者兴趣是否以及在多大程度上转向风险曲线外,我们可以参考来自Uniswap流动性池的数据。由于山寨币通常通过去中心化交易所由更多加密原生交易者进行交易,最早建立的DEX上的活动可以作为山寨币交易趋势的代理(注意:此数据反映了以太坊主网上的Uniswap交易)。
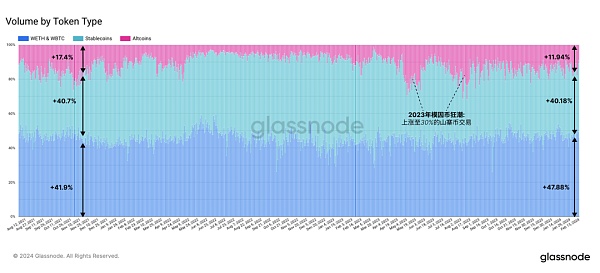
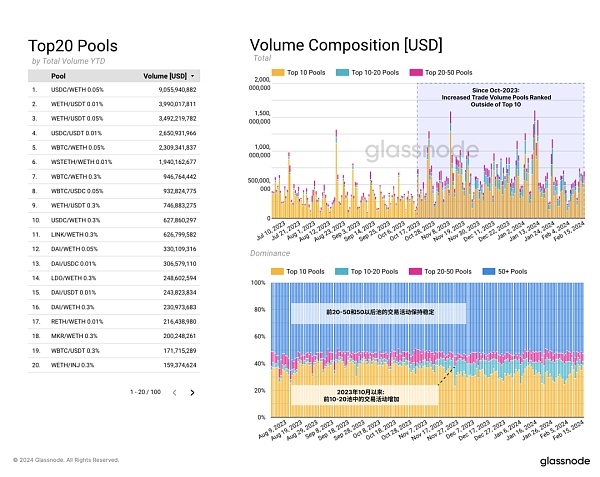
2022年熊市期间,山寨币交易兴趣非常低,但在2023年中期开始增加,主要是受到“迷因币疯狂”潮流的推动。当前,山寨币交易占Uniswap交易量近12%,接近上次牛市高峰时的17.4%。相比之下,WBTC和WETH的交易占交易量的47%,稳定币占40%。
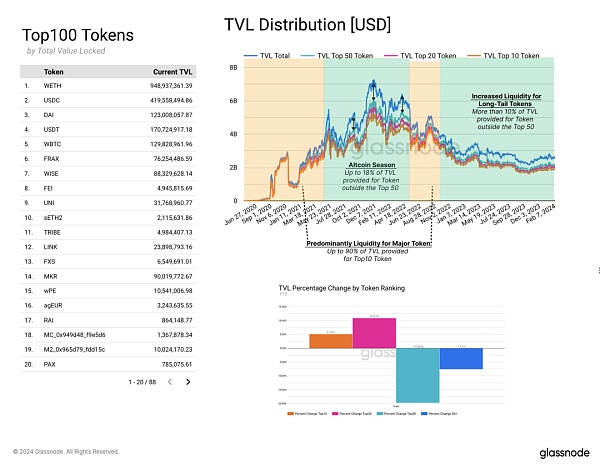
Uniswap上的流动性提供者倾向于密切监控市场,流动性在各个池中的分布变化可以提供市场趋势的指示。通过检查Uniswap上的总锁定价值(TVL)的构成,我们观察到在山寨季节期间,排名前50以外的代币的流动性配置增加。这一趋势表明投资者对长尾代币的兴趣增长。
在熊市期间,流动性主要为前50个代币提供,因为这是大部分交易量发生的地方。前10个代币主要由WETH、WBTC和稳定币组成。
通过查看每个代币类别的TVL百分比变化,我们可以检测到为前10(5.14%)和前20(10.9%)代币提供的流动性增加,而排名20到50的代币则被移除了流动性。这表明市场对长尾资产的需求尚未显著增长。
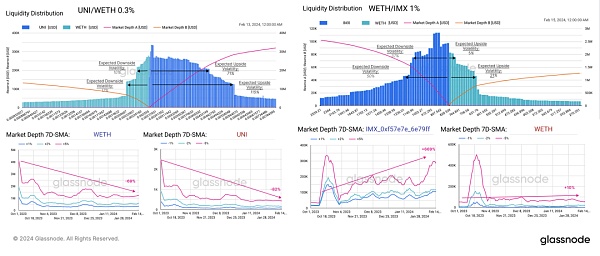
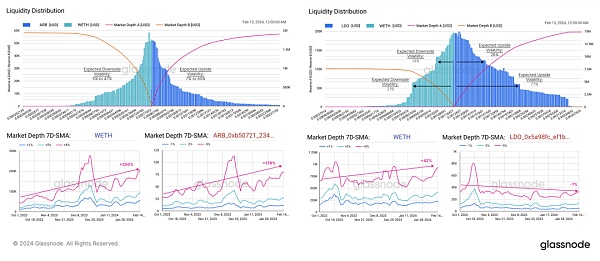
我们现在将检查以太坊各个领域中顶级代币的流动性池。这包括评估流动性在各个价格范围内的分布,并观察市场深度的演变(类似于我们在链上周报第36周中建立的假设)。
山寨币和WETH储备之间的分布相对平衡,预期上行波动性整体略高。这表明流动性提供者对这些代币普遍持有看涨的观点。GameFi代币IMX是个例外。
当观察流动性分布变化率时,我们看到-5%和+5%范围的市场深度增加,表明流动性提供者正在为一个价格波动较大的时期做准备。
UNI是个例外,市场制造者将流动性越来越集中在当前价格范围附近。这表明预期UNI代币的价格波动较小,鉴于它是最成熟和稳定的代币之一,这并不令人意外。现在我们与交易者的行为相对比,我们可以观察到自2023年10月以来Uniswap的交易量增加,包括排名前10以外的代币。
与此相反的是交易者的行为,我们可以观察到自2023年10月以来Uniswap上的交易量增加,包括Top 10以外的代币。前10到前20的代币对的交易活动也在上升。
然而,排名前20-50的代币对以及排名50+的交易活动保持不变,这再次验证了我们先前的假设。虽然流动性提供正向更高风险曲线移动,但交易量尚未跟上。
四、总结和结论
新比特币ETF的市场动力,以及对数字资产牛市的预期开始引起资金流向山寨币的转变。我们的山寨币指标表明,替代币市场可能会出现更加成熟且可能持续的上涨,但目前仍然相对集中在较高市值的资产中。
过去的一个周期中,数字资产格局发生了显著变化,新的生态系统出现挑战以太坊的主导地位。Solana在过去一年中表现最强,但Polkadot和Cosmos生态系统内也开始有所活动。在以太坊生态系统内,质押领域的顶级代币显示出最为一致的资本流入。
Uniswap上山寨币交易的复苏,连同流动性和交易量模式,强调了对长尾资产日益谨慎而增长的兴趣。这最初体现在变化的流动性提供上,以及对高波动性的预期。然而,这尤其存在于池中的TVL内,投资者的交易量尚未跟进。
Since October last year, our kinetic energy index of counterfeit currency shows that investors' willingness to further transfer capital to the risk curve is increasing. Although the dominant position of Bitcoin is still remarkable, we have seen early signs that more capital has begun to transfer to Ethereum and ecosystem. By investigating the liquidity pool, we can see that most of the capital is still in the most mature assets, although the total locked value is moving outside the risk curve, but the following of trading volume is slow, which is expected. Counterfeit currency season: With the increasing momentum of the new spot bitcoin exchange trading fund, the bull market in the field of digital assets may have begun. Under this background, we will continue to discuss whether the capital covered in the weekly chain report will flow into counterfeit currency. In this issue, we will focus on the further performance of assets on the risk curve and evaluate how the capital rotates and flows in the counterfeit currency market. We will once again use our counterfeit currency indicator as a macro indicator, and see the evaluation of this indicator in the weekly report of 2008. Estimate whether positive kinetic energy is forming in the market value of the total exchange currency, and with the continuous inflow of funds into Bitcoin Ethereum and stable currency, our counterfeit currency index has been showing positive kinetic energy since October last year, although it was temporarily suspended in the news event of selling bitcoin after it was approved, and it was re-triggered on March. In terms of market value ratio, Bitcoin continues to lead the total market value of the entire digital asset market. In contrast, Ethereum accounts for stable currency and the rest of counterfeit currency accounts for asset performance. The year-to-date growth rate is and we noticed that it began to surpass Bitcoin after it was approved, which is a change of relatively poor performance since. However, overall, the market value of Shanzhai coins has not performed well, and the growth rate since the year-to-date is less than half of that of the two major currencies. Another way to track the performance is to use the realized market value of each industry, which summarizes the cost basic value of all currencies transferred on the chain. From this list, we can better evaluate the mobile bitcoin of capital in the digital asset market. Once again, it is obviously ahead. At present, almost $100 million of capital flows into Ethereum every month, and the capital inflow often lags behind Bitcoin. This shows that investors are seeking confidence and confirming that the digital asset market is growing. In the annual cycle, the peak of new capital inflow appears the day before the peak of inflow. Shanzhai coins tend to show a similar lag after showing a strong trend. Obviously, the speed of capital flow to Shanzhai coins is slower than the rotation between the two major cryptocurrencies. The next problem is to observe how it flows further on the risk curve over time. In the last cycle, several new first-tier ecosystems appeared, many of which not only competed with Ethereum in innovation and attracting users, but also in investment capital. Therefore, we examined the top five token Ethereum in some selected ecosystems and evaluated which ones attracted the most investors. Interest here, we compare the weekly change of the total market value of the first five tokens in each ecosystem, which has shown a relatively high volatility in the past months. The upward performance is particularly prominent and the volatility is similar, but the ecosystem performance is better than the latter. In the Ethereum ecosystem, we can specify three main areas and pledge. Since the beginning of this year, all three industries have seen capital inflows, but there has been a relatively large capital outflow from the industry in and this year, and the fields have reversed since the beginning of this year. The initial significant inflow is consistent with the time point triggered by our counterfeit currency index. In contrast, pledged tokens have been experiencing positive capital inflows, although the absolute amount is relatively small. To determine whether and to what extent investors' interest has turned outside the risk curve, we can refer to the data from the liquidity pool. Because counterfeit currency is usually traded by more encrypted primary traders through decentralized exchanges, the earliest established activities can be used as a substitute for the trading trend of counterfeit currency. It should be noted that this data reflects that the trading interest in counterfeit currency on the main network of Ethereum is very low during the bear market in the year, but it began to increase in the middle of the year, mainly driven by the crazy trend of meme currency. At present, the trading volume of counterfeit currency is close to that at the peak of the last bull market, and the trading volume of sum currency is stable. Liquidity providers tend to closely monitor the distribution and changes of market liquidity in each pool, which can provide an indication of market trends by checking the composition of the total locked value. We observed that the liquidity allocation of the tokens that were not ranked before increased during the cottage season, which indicated that investors' interest in the long tail tokens increased. During the bear market, liquidity was mainly provided for the previous token, because this is where most of the trading volume occurred. The previous token was mainly composed of stable and stable coins. By looking at the percentage change of each token category, we can detect that the liquidity provided for the previous and previous tokens increased, while the ranked tokens were removed, which indicated that the market was interested in long-term development. The demand for tail assets has not increased significantly. We will now check the liquidity pool of top tokens in various fields of Ethereum, including evaluating the distribution of liquidity in various price ranges and observing the evolution of market depth, which is similar to the assumption that the distribution between counterfeit coins and reserves is relatively balanced in the first week of the weekly chain report. It shows that liquidity providers generally hold a bullish view on these tokens, and tokens are an exception. It is not surprising that the increase in market depth of the scope indicates that liquidity providers are preparing for a period of large price fluctuation, which is an exception. Market makers are increasingly concentrating liquidity near the current price range, which indicates that the price fluctuation of expected tokens is relatively small. Given that it is one of the most mature and stable tokens, it is not surprising that now we are compared with traders. We can observe that the transaction volume has increased since January, including tokens outside the top ranking, and the opposite is trading. We can observe that the trading volume has increased since June, including the trading activities of the token pairs before and after other tokens, but the trading activities of the token pairs before and after the ranking remain unchanged, which once again verifies our previous hypothesis that although liquidity provides a higher risk curve, the trading volume has not kept up with the four summaries and conclusions. The market momentum of new bitcoin and the expectation of the bull market of digital assets have begun to cause the capital to flow to the counterfeit currency. Our counterfeit currency indicators show that the substitute currency market may be more mature and may continue to rise, but it is still relatively concentrated at present. 比特币今日价格行情网_okx交易所app_永续合约_比特币怎么买卖交易_虚拟币交易所平台
注册有任何问题请添加 微信:MVIP619 拉你进入群

打开微信扫一扫
添加客服
进入交流群
1.本站遵循行业规范,任何转载的稿件都会明确标注作者和来源;2.本站的原创文章,请转载时务必注明文章作者和来源,不尊重原创的行为我们将追究责任;3.作者投稿可能会经我们编辑修改或补充。