
从 LTH 和 STH 供应看 BTC 牛熊周期


作者:Murphy 来源:X,@Murphychen888
昨天分享了从BTC持有者已实现市值波形数据看牛熊周期的转换。有小伙伴在评论区留言,提到由于ETF的通过,会不会对数据的准确性造成干扰。我们可以用另外一组数据来回答大家的诱惑。
下图是 #BTC流通筹码中长期持有者(LTH:蓝线)和短期持有者(STH:红线)分别持有的筹码数量变化曲线。我们可以看到,在2023年12月1日LTH从最高点开始拐头向下,当天持有峰值为1491w枚BTC;截止到2024年3月26日LTH持有1402w枚,共计减少89w枚。这其中就包含了灰度抛售的27w枚。
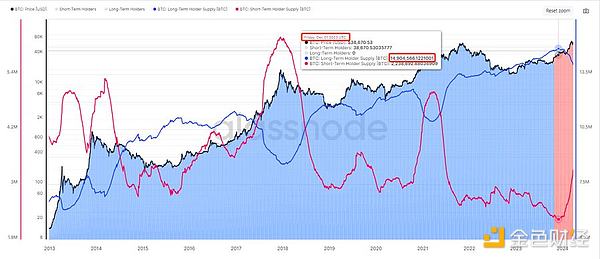
众所周知灰度GBTC中留存的BTC都是上一个周期的筹码,也同属于LTH;ETF的通过促成了这部分LTH的筹码加速离场。但反过来说,如果没有ETF的通过,也就不会有这么多圈外机构的资金入场,BTC的价格也不会历史上首次在减半之前就创新高。而这些新入场的资金购买的BTC,又同属于STH;
因此,只能说ETF的通过改变了传统牛市的节奏,造成本轮周期中的“非典型”性牛市。但筹码结构的转换其背后的本质还是整个市场的供需关系,ETF的买和卖本身就包含在这个底层关系之中。对于分析师来说,其面临的挑战,就是识别出在非典型牛市中的卖出压力可能达到过饱(LTH派发)和新需求耗尽(STH承接)的临界点时期,也就是我们俗称的“逃顶”。
另外,还有小伙伴提到本轮周期中BTC L2生态的发展,让很多钱包中的BTC发生了转移(通过质押获得收益),比如Meilin生态中积累了近4w枚 BTC;但这部分移动的筹码中,既有LTH的移动,也有STH的移动。
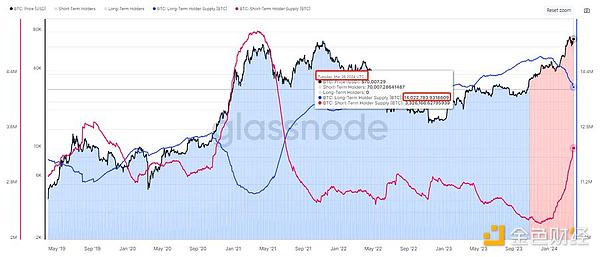
从上图中看2023年12月3日起STH从最低点开始拐头向上,当天持有低值为224w枚BTC;截止到2024年3月26日STH持有332w枚,共计增加108w枚。其中89w枚是LTH转移到STH,剩下19w枚是STH之间发生的转移。L2这个因子对整体数据权重的影响只占到3.7%,因此确实算是一个影响因素,但从数据上看对整体判断结论的“干扰”并不大。
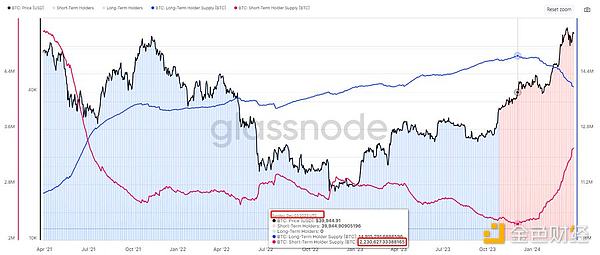
昨天我们通过币龄过度看牛熊周期转换,今天再看另外一个数据:BTC长期和短期持有者供应周期指标。
通过观察我们可以发现,在之前几轮牛市的顶峰,长期持有者(LTH)的供应下降了14%到25%,这表明每个周期都存在一定程度的卖出压力。相反,短期持有者(STH)供应往往在周期顶部达到最大,从其周期底部增加了83%到127%。

而当前3月份,LTH供应下降了-4.2%,STH供应上升了36%,如果我们用一个简单的估算,假设这些回撤或上升的幅度反映了周期高点的供需拐点,可以得出当前市场已经经历了典型卖出周期的30%左右的进程。和昨天说的牛市已经走完1/3的观点类似。
通常,分析师对周期的区分上会有各自不同的观点。但我个人会排除熊转牛初的过度期,也就是从2023年1月到11月底,BTC从18,000美元到38,000美元这个阶段。从2023年12月1日LTH供应出现拐点,可以将其视为本轮正式进入牛市周期的标志性事件,至今大约4个月左右的时间。如果按此推算,本轮牛市第1阶段或许还剩余8个月左右的时间。
为什么说是第1阶段,难道还有第2阶段吗?我认为有这个可能,这就要看美联储降息周期和美国大选周期对市场产生的影响是否重叠,亦或是有较长的间隔期。如果间隔期较长,不排除会出现牛市双顶或多顶的可能。
具体的逻辑分析,可以参考倪大 @Phyrex_Ni 的大型专题置顶帖 —— “牛市上涨的高潮期需要满足哪些条件”
此处我就不再累述。而我们当前所关注的,就是本轮牛市第1阶段的高点(如果有第2阶段,届时仍然用数据说话)。
周期的判断决定着我们的投资决策,尽管从时间维度上的论述并不一定精准,也无法预测具体的价格点位。但至少在大方向做到了然于心。例如,既知牛市进入“中期”,更应该坚定持有的信心,如有看好的潜力币,即便出现回调也无需恐慌,或是前期没有跟涨的优质币,也可以适当布局,因为ALT往往都是在牛市的中后期才会开启全面爆发模式。
Yesterday, the author shared the waveform data of the realized market value of the holders to see the conversion of the bull-bear cycle. Some friends left a message in the comment area, saying that the passing of the data will not interfere with the accuracy of the data. We can use another set of data to answer everyone's temptation. The following figure shows the change curve of the number of chips held by the blue line of the long-term holder and the red line of the short-term holder in circulation chips. We can see that the peak value is held from the highest point to the end of the day. There is a total reduction in the number of chips, including the long push of gray selling. From the data, we can see the conversion of the bull-bear cycle. It is well known that all the chips left in the gray level belong to the last cycle, which has contributed to the accelerated departure of this part of the chips. On the other hand, if it is not passed, there will not be so many funds from outside the circle, and the price of admission will not reach a new high before halving for the first time in history, and these new funds purchased belong to the same. Therefore, it can only be said that the atypical bull market in this cycle has been caused by changing the rhythm of the traditional bull market, but the essence behind the conversion of the chip structure is that the buying and selling of the supply and demand relationship of the whole market itself is included in this underlying relationship. For analysts, the challenge is to identify the critical period when the selling pressure in the atypical bull market may reach the point of over-distribution and new demand exhaustion, which is what we commonly call escape from the top. In addition, some small partners mentioned this cycle. With the development of ecology, many wallets have been transferred, and gains have been made through pledge. For example, nearly one piece has been accumulated in the ecology, but some of the moving chips have moved and some have moved. From the data, we can see the change of the bull-bear cycle. From the above figure, we can see that the low value held on that day is one piece, and the total number of pieces held by the end of the year is one piece. The influence of this factor on the overall data weight is only one, so it is really considered. However, from the data point of view, the interference to the overall judgment conclusion is not great. Yesterday, we looked at the bull-bear cycle conversion through the excessive currency age. Today, we look at another data, the long-term and short-term holders' supply cycle indicators. Through observation, we can find that the supply of long-term holders has dropped to a certain extent at the peak of previous bull markets, which shows that there is a certain degree of selling pressure in each cycle. On the contrary, the supply of short-term holders often reaches its maximum at the top of the cycle, and it has increased from the bottom of the cycle to the long-term push from the data. Looking at the conversion of the bull-bear cycle, the supply has declined and the supply has increased in the current month. If we use a simple estimate and assume that these retracements or increases reflect the inflection point of supply and demand at the high point of the cycle, we can conclude that the current market has gone through the process of a typical selling cycle, which is similar to the view that the bull market has finished yesterday. Usually, analysts will have different views on the division of the cycle, but I personally will rule out the transition period from bear to bull, that is, from January to the end of the month from US dollar to US dollar. This stage can be regarded as a landmark event that the current round officially entered the bull market cycle since the turning point of supply on March. If we calculate the first stage of this bull market according to this, there may be about months left. Why is it the first stage? Is there still a first stage? I think it is possible. It depends on whether the impact of the Fed's interest rate cut cycle and the US election cycle on the market overlaps or whether there is a long interval. If the interval is long, a bull market will not be ruled out. The possible concrete logical analysis of double-top or multi-top can refer to Ni Da's large-scale topic, which conditions need to be met during the high tide of bull market rise. I won't repeat them here, but what we are currently concerned about is the high point of the first stage of this bull market. If there is a first stage, the judgment of the data speaking cycle will still determine our investment decision. Although the discussion from the time dimension is not necessarily accurate, it is impossible to predict the specific price point, but at least it is clear in the general direction, such as knowing the bull. When the market enters the mid-term, it should hold firm confidence. If there is a promising potential currency, there is no need to panic even if there is a callback, or the high-quality currency that did not follow up in the early stage can be properly laid out, because it is often in the middle and late stage of the bull market that the full-scale outbreak mode will be started. 比特币今日价格行情网_okx交易所app_永续合约_比特币怎么买卖交易_虚拟币交易所平台
注册有任何问题请添加 微信:MVIP619 拉你进入群

打开微信扫一扫
添加客服
进入交流群
1.本站遵循行业规范,任何转载的稿件都会明确标注作者和来源;2.本站的原创文章,请转载时务必注明文章作者和来源,不尊重原创的行为我们将追究责任;3.作者投稿可能会经我们编辑修改或补充。