重返通缩 以太坊蓄势待发?


最近几周,随着越来越多的以太坊验证者自愿离场,以太坊的验证者人群的数量增长开始有所放缓,这同时降低了以太坊的开采速度。由于以太坊网络中的活动不断增加,经由EIP-1559协议所燃烧的以太坊数量也水涨船高,这使得以太坊的供应再度陷入通缩。
摘要
以太坊质押的趋势变化日趋显著。自10月份以来,退出的验证者数量不断增加。这一变化与数字资产市场的看涨趋势密切相关。
验证者退出数量增加导致以太坊的每日开采量下降,而这一变化与质押pool中的活跃以太坊的数量息息相关。
与此同时,由于人们对各类数字资产和稳定币重新报以密切关注,我们不难发现当前的以太坊网络活动有所增加。这反映在通过EIP-1559燃烧的Gas费用增加引发了ETH供应的通货紧缩这一事实上。
毫无疑问,在过去一周中最重要的头条新闻是币安首席执行官CZ的辞职。在此前的诉讼中,币安与当局达成的最终和解金额为43亿美元,许多人将这一关键事件视为数字资产行业野蛮生长时代结束的标志。
此公告发布后,BNB的价格下跌了9.1%。然而,与之前的价格下跌相比,这一市场反应相对温和——在今年早些时候SEC宣布他们将指控币安的时候,BNB创下了高达24%的跌幅。
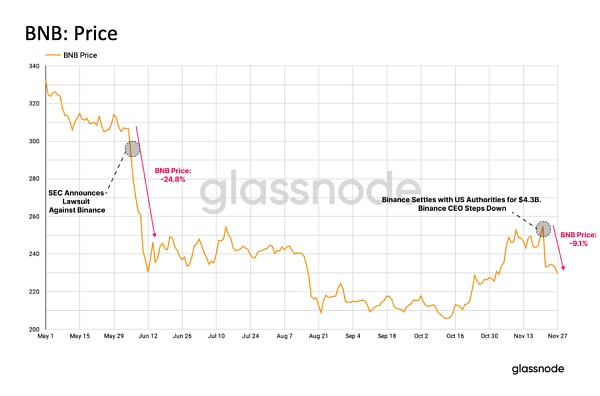
图1:BNB价格走势
此消息发布后,币安主要资产的提款活动有所增加。一系列DeFi“蓝筹股”的总余额在此前的24小时内下降了6.7%,而比特币、以太坊和稳定币余额分别下降了4.4%、4.9% 和2.2%。
然而,在CZ辞职后的六天内,币安的余额出现复苏迹象——所有四类数字资产的流出均有所放缓,甚至恢复了净流入。从很多方面来说,这都表明了用户对币安平台的信任程度。也有人认为,考虑到币安应能达成与未来三年美国监管机构监管的和解,用户对交易平台的信心甚至可能会重新得到提振。
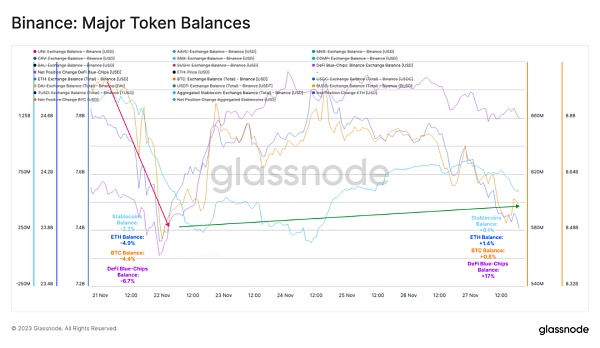
图2:币安主流资产近期余额变化
验证者退出
尽管没有像币安那样成为头条新闻,但是自今年10月以来,以太坊质押pool在经历着明显的变化。现在,越来越多的验证者正在退出质押。
随着上海升级中的“质押提现”机制的正式启动,退出质押、变现收益的用户数量大幅增长,与此同时质押提供者及其设备也迎来日趋激烈的大洗牌。在这一段时间中,平均每天有319名验证者退出质押。
自10月初以来,我们可以看到这种退出行为仍然在不断增加,甚至达到平均每日有1,018名验证者退出的峰值。这一上涨趋势与近期数字资产市场现货价格的上涨趋势相一致。
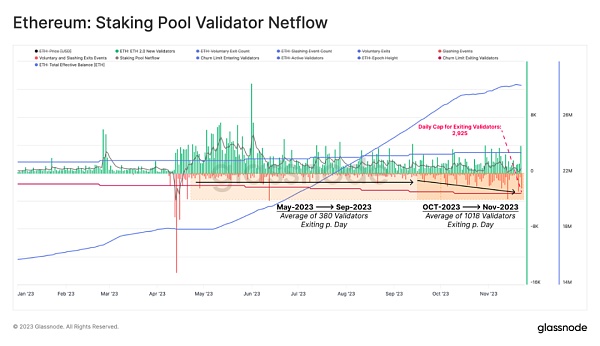
图3:以太坊验证者流量
因此,代表积极参与权益证明共识的以太坊的总有效质押余额增长放缓,目前该指标正在经历上海升级以来的首次下降。
质押pool中总有效余额的增长梯度自10月中旬开始趋于平缓,其平均每天的增长速度为0.1%至1%,较5月份以来的增速减少一半以上。
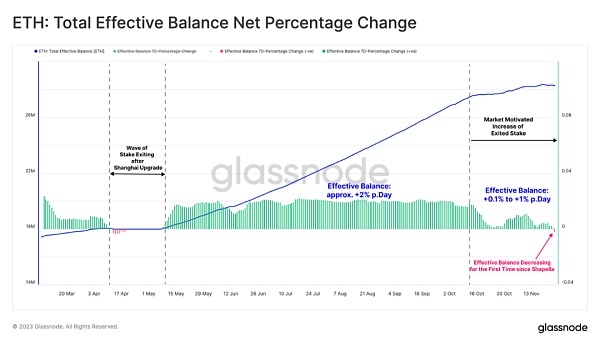
图5:以太坊总有效余额净百分比的变化
我们仔细考量了这些退出的验证者的情况,最后发现,他们大部分都是在过去八周“自愿退出”的。“自愿退出”指的是验证者自行选择退出质押,这与从质押pool中被“削除”不同——后者是对违反协议规则的验证者的惩罚。
在相同的这一时段内,以太坊网络只出现过两次“削除”事件,其中一件规模较大。该事件牵涉到100名新入场的验证者,他们因为同时在两个不同区块上签名而受到惩罚。
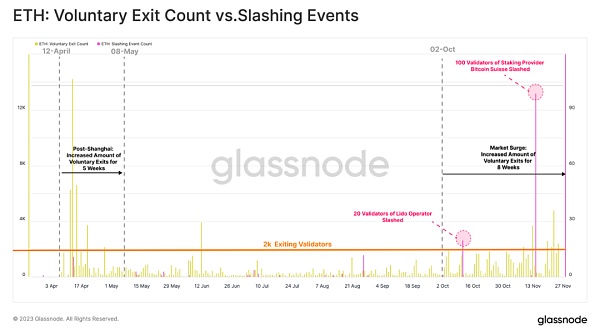
图6:以太坊网络中自愿退出事件与“削除”事件对比
这些退出的验证者可以根据其所属的质押者类型进行进一步的分类。这种分类向我们揭示了一些有趣的现象:
自10月份以来,中心化交易平台(CEX)一直是质押提现主阵地,其中Kraken和Coinbase的资金流出量最大。
被撤回的质押也出现了小幅上升,Lido仍然是该领域最大的参与者。
有几点可能会推动以上这几种投资者的行为:
可能是受持续的监管压力所迫,投资者选择更改他们的质押配置,例如将质押的以太坊从CEX转移到流动性更高的质押提供商处。
由于美国国债等更安全的资产的利率较当前的以太坊质押有更高的回报,因此能够进入美国资本市场的投资者会更倾向于将资金投入前者而非后者。
投资者也可能会为持有的以太坊寻求更大的流动性,以应对即将到来的市场上涨趋势,而非继续持有这些流动性较低的以太坊。
我们注意到,在出现质押提现的CEX中,Kraken和Coinbase居于主要地位,而最高的高流动性质押供应商退出率则来自于Lido。但是我们必须指出的是,以Lido为代表的这些实体同时也是以太坊质押的主要接受者,这显示了这些大型机构良好的投资者粘性和它们在市场中的超然地位。
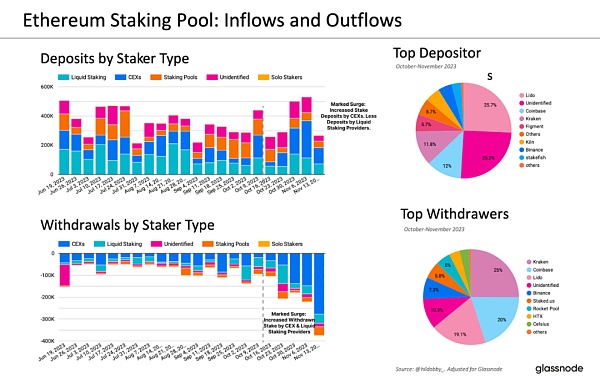
图7:以太坊质押:流入与流出
在净变化量的基础上,Lido的主导地位越发稳固,其总质押余额增加了468,000枚以太坊。在CEX中,Coinbase和币安的质押余额依然处于净增加状态,而Kraken的质押余额则减少了19,400枚以太坊。在质押提供商中,HTX和Staked.us的质押余额减少幅度最为显著,均减少了超过44,000枚以太坊。
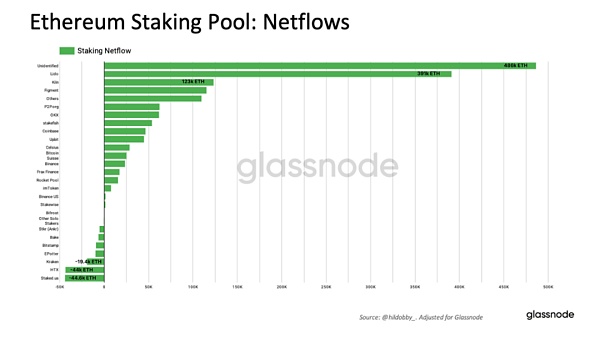
图8:以太坊质押:净流量
与我们观察到的有效余额减少相一致的是,以太坊的开采量也相应减少——因为每日开采出的以太坊数量取决于活跃验证者的数量,或质押pool内的总有效余额。
随着验证者的增长速度放缓甚至下降,每日以太坊的开采量也相应走低。在过去7天里,以太坊开采量的增长率每天下降0.5%。值得注意的是,这是开采量的增长率在近期首次出现下降。
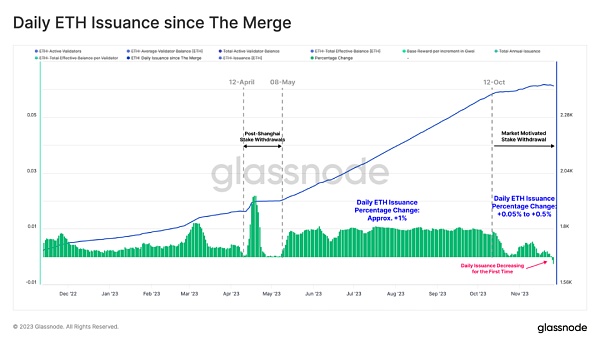
图9:自合并以来的以太坊日开采量
随着以太坊的开采率下降,我们现在可以将注意力转向另一个可作为研究补充的方面——燃烧率。随着EIP-1559协议所启用的费用燃烧机制始于2021年伦敦硬分叉,该部分内容涉及以太坊燃料部分的交易费用,它为以太坊供应随着网络使用量的增加而出现通货紧缩这一现象奠定了理论基础。
考虑到近期出现的gas费用的上涨意味着以太坊网络上的交易需求不断增长,那么显而易见,每日消耗的费用也随之增加。在整个10月份,网络中每天被燃烧掉的费用达到899枚以太坊。而到了近一个月,当前累计已经有5,368枚以太坊在全网交易中作为燃料被燃烧掉。
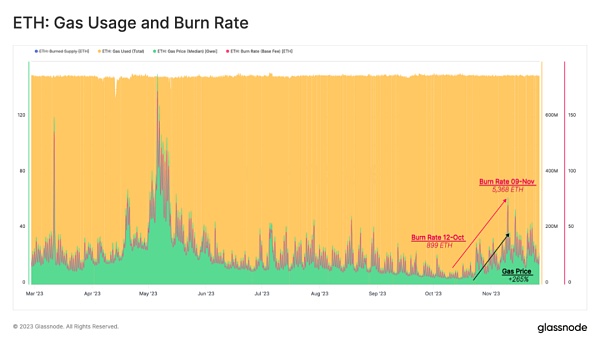
图10:以太坊:Gas费用及燃烧率
除此之外,我们还可以评估各种交易类型的Gas使用情况的详细账目。这些指标使我们能够识别那些主要导致供应消耗的行为。
通过研究历史上对以太坊网络应用推动作用最大的两个领域——NFT和DeFi,我们可以明显看出,这两个领域中的交易行为在过去四个月中相对较少,相较此前分别下降了3%和57%。我们对此的结论是,这两个领域与以太坊网络的绑定强度正在减弱,并且它们对最近链上活动的激增贡献甚微。
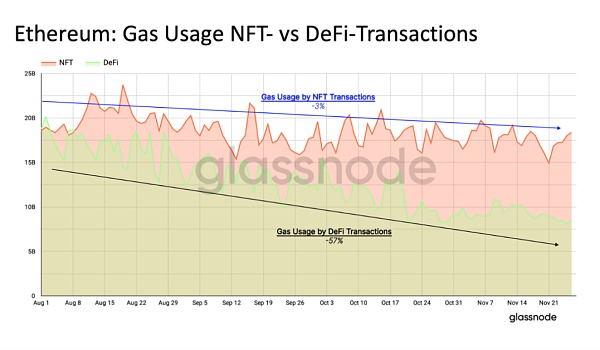
图11:以太坊:NFT与DeFi交易中的Gas费用
最近以太坊网络活动的激增应该主要归因于数字资产和稳定币的交易。在过去三个月,这些数字资产的Gas量增加了8.2%,而稳定币的Gas量增加了19%。这表明,随着对市场的信心增强,资本可能会转向长尾资产。
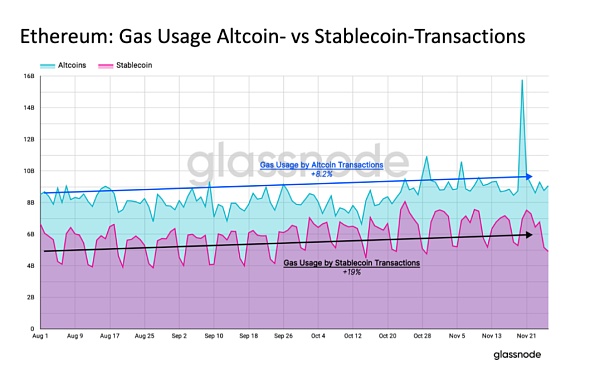
图12:以太坊:其他数字资产交易与稳定币交易的Gas费用
自伦敦硬分叉以来,以太坊从净通胀过渡到均衡继而进入彻底的通缩状态。值得注意的是,由于以太坊网络活动的减少,它在8月至10月期间经历了短暂的净通胀。
最近几周,由于发行率下降和供应量增加,以太坊的总供应量再次出现净通缩。
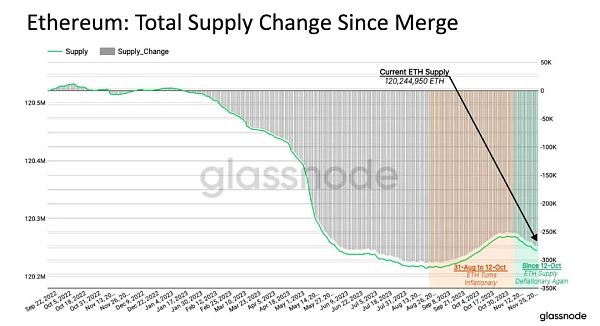
图13:以太坊:合并之后的市场总供应量
总结
最近几周,随着退出质押pool的验证者数量开始增加,以太坊质押动态发生了显著变化。这导致当前以太坊的开采量增速放缓,以及自上海升级以来质押余额首度减少。
此外,最近以太坊网络活动出现的激增,特别是由其他数字资产转移和稳定币交易推动的网络活动,导致交易需求增加。这反过来又给Gas价格带来了上行压力,导致通过EIP-1559协议而燃烧的每日以太坊费用增加。
在这种背景下,我们能够愈发清晰地看到,以太坊的网络情况、市场供应是和包括其他数字资产的交易情况,以及深度依赖于以太坊网络的诸如DeFi、NFT等领域的活动状况等外部因素相互作用的。由此可见,以太坊的通缩,其实是上述诸多因素叠加下的自然结果。
In recent weeks, with more and more Ethereum verifiers leaving voluntarily, the number of Ethereum verifiers has begun to slow down, which at the same time slows down the mining speed of Ethereum. Due to the increasing activities in Ethereum network, the number of Ethereum burned through the agreement has also risen, which has caused the supply of Ethereum to fall into deflation again. The trend of Ethereum pledge has become increasingly obvious, and the number of verifiers who have withdrawn has been increasing since January. This change is in line with the bullish trend of digital asset market. The increase in the number of verifiers who are closely related leads to the decline in the daily production of Ethereum, which is closely related to the number of active Ethereum in pledge. At the same time, due to people's close attention to various digital assets and stable coins, it is not difficult to find that the current Ethereum network activities have increased, which is reflected in the deflation of supply caused by the increase in burning costs. In fact, there is no doubt that the most important headline news in the past week was the CEO of Coin Security. Resignation In the previous lawsuit, the final settlement reached between Bi 'an and the authorities was US$ 100 million. Many people regarded this key event as a sign of the end of the era of barbaric growth of the digital asset industry. However, compared with the previous price decline, this market reaction was relatively mild. When it was announced earlier this year that they would accuse Bi 'an, the price trend reached a high level. After the news was released, the withdrawal activities of major assets of Bi 'an increased the total of a series of blue chips. The balance dropped in the previous hours, while the balance of Bitcoin Ethereum and Stable Coin dropped respectively. However, within six days after resignation, the balance of Coin An showed signs of recovery, and the outflow of all four types of digital assets slowed down or even restored the net inflow. In many ways, this shows the trust of users in Coin An platform. Some people think that considering that Coin An should reach a settlement with the supervision of American regulators in the next three years, users' confidence in the trading platform may even be boosted again. Although the recent balance changes of mainstream assets in Tubi 'an have not made headlines like Bi 'an, the pledge of Ethereum has undergone obvious changes since this year. Now more and more verifiers are withdrawing from the pledge. With the official launch of the pledge withdrawal mechanism in Shanghai, the number of users who have withdrawn from the pledge to realize the benefits has increased significantly. At the same time, the pledge providers and their equipment have also ushered in an increasingly fierce reshuffle. During this period, an average of 100 verifiers have withdrawn from the pledge every day. Since the beginning of the month, we can see that this withdrawal behavior is still increasing, even reaching the peak of the average daily withdrawal of famous verifiers. This upward trend is consistent with the recent upward trend of spot prices in the digital asset market. The flow of verifiers in Ethereum therefore represents the slowdown in the growth of the total effective pledge balance of Ethereum, which actively participates in the consensus of equity certification. At present, this indicator is experiencing the first decline since the upgrade in Shanghai, and the growth gradient of the total effective pledge balance has become flat since the middle of the month. Its average daily growth rate has been reduced by more than half compared with that since last month. We have carefully considered the changes of the net percentage of the total effective balance of Ethereum, and finally found that most of them voluntarily withdrew in the past eight weeks. Voluntary withdrawal means that the verifiers voluntarily chose to withdraw from the pledge, which is different from being removed from the pledge. The latter is the punishment for the verifiers who violated the agreement rules. In the same period, there have only been two removal incidents in Ethereum network. One of the large-scale events involved two newly-admitted verifiers who were punished for signing two different blocks at the same time. Figure Comparison between voluntary withdrawal events and deletion events in the Ethereum network, these withdrawn verifiers can be further classified according to the types of pledges they belong to. This classification reveals some interesting phenomena to us. Since January, the centralized trading platform has been the main position for pledge withdrawal, and the withdrawn pledge with the largest outflow of funds has also appeared. In addition to a small increase, it is still the largest participant in this field. There are several points that may promote the behavior of these investors, which may be forced by continuous regulatory pressure. Investors choose to change their pledge configuration, such as transferring the pledged Ethereum from to a more liquid pledge provider. Because the interest rate of safer assets such as US Treasury bonds has a higher return than the current Ethereum pledge, investors who can enter the US capital market will be more inclined to invest in the former rather than the latter. Investors may also seek greater liquidity for their Ethereum to cope with the upcoming market upward trend instead of continuing to hold these ethereum with lower liquidity. We note that the withdrawal rate of high-liquidity pledge suppliers is the highest in the middle of pledge withdrawal, but we must point out that these entities are also the main recipients of Ethereum pledge, which shows the good investor stickiness of these large institutions and their presence in the market. The transcendental position chart in the field shows that the dominant position of the pledge inflow and outflow of Ethereum has become more and more stable on the basis of the net change, and its total pledge balance has increased, while the pledge balance of Ethereum in Zhonghe Bi 'an is still in a net increase state, while the pledge balance has decreased, and the pledge balance of Ethereum in the pledge provider has decreased most significantly, all of which have decreased by more than Ethereum. Consistent with the observed decrease in effective balance, the net pledge flow of Ethereum has also decreased accordingly. Less because the number of ethereum mined every day depends on the number of active verifiers or the total effective balance in the pledge. With the growth rate of verifiers slowing down or even declining, the daily mining volume of ethereum has also decreased accordingly. In the past few days, the growth rate of ethereum mining volume has decreased every day. It is worth noting that this is the first time that the growth rate of mining volume has decreased in the near future. Since the merger, the daily mining volume of ethereum has decreased with the mining rate of ethereum. Now we can turn our attention to another one. The supplementary aspect of the research is the burning rate. With the agreement, the burning mechanism started in London in 1998. This part involves the transaction cost of the fuel part of Ethereum, which lays a theoretical foundation for the phenomenon that the supply of Ethereum is deflating with the increase of network usage. Considering that the recent increase in the cost means that the transaction demand on the Ethereum network is increasing, it is obvious that the daily cost is also increasing. In the whole month, the daily cost burned in the network has reached one Ethereum, and by the end of the past month, one Ethereum has been burned as fuel in the whole network transaction. 比特币今日价格行情网_okx交易所app_永续合约_比特币怎么买卖交易_虚拟币交易所平台
注册有任何问题请添加 微信:MVIP619 拉你进入群

打开微信扫一扫
添加客服
进入交流群
1.本站遵循行业规范,任何转载的稿件都会明确标注作者和来源;2.本站的原创文章,请转载时务必注明文章作者和来源,不尊重原创的行为我们将追究责任;3.作者投稿可能会经我们编辑修改或补充。