
如何赚周期的钱:抄底逃顶指南


一、概要
这是我们周期系列的最后一篇文章,前三篇都是从宏观角度对周期进行了分析,这一篇将主要介绍如何使用指标判断顶底以及如何优化投资策略。
二、五大指标教你如何判断顶底
1、Ahr999 囤币指标
指标介绍:该指标由微博用户 Ahr999 创建,辅助比特币定投用户结合择机策略做出投资决策。该指标隐含了比特币短期定投的收益率及比特币价格与预期估值的偏离度。
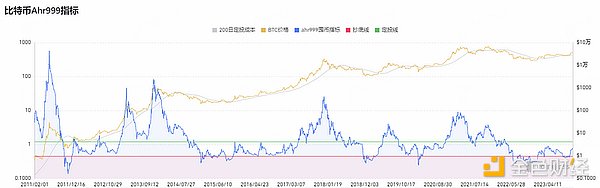
如何使用:
当 ahr999 指数 < 0.45 ,可以抄底:
当 ahr999 指数在 0.45 ~ 1.2 之间,则适合定投;
当 ahr999 指数 > 1.2,币价相对较高,不适合定投。
实时图表:https://www.coinglass.com/zh/pro/i/ahr999
2、彩虹图
指标介绍:彩虹图是比特币的长期估值工具。它使用对数增长曲线来预测比特币潜在的未来价格方向。
它在对数增长曲线通道的顶部覆盖彩虹色带,试图在价格通过它时突出每个彩虹色阶段的市场情绪。因此突出潜在的买卖机会。
迄今为止,比特币价格继续保持在对数增长通道的彩虹色带内。
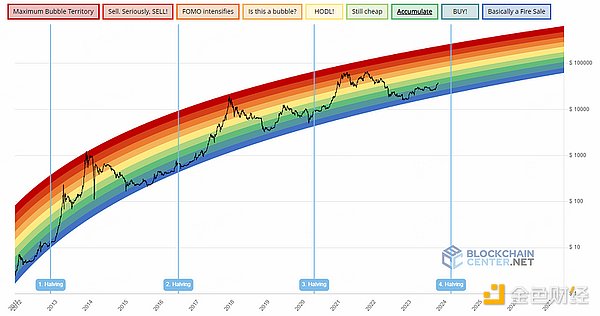
如何使用:
越靠近蓝色,代表价格越接近底部
越靠近红色,代表价格越接近顶部
实时图表:https://www.blockchaincenter.net/en/bitcoin-rainbow-chart/
3、RSI
指标介绍:RSI(Relative Strength Index,相对强弱指标)是一种衡量比特币价格变动的速度和幅度的指标,以观察的月份的前 12 个月表现计算出 RSI 分数,用来判断市场走势强弱,正处于超买还是超卖的区间。上涨的力道越强,RSI 就会越接近 100,而高 RSI 也表示价格变动在过去的 12 个月内较为正面;反之下跌的力道越强,RSI 就会越接近 0,低 RSI 值意味著价格变动相对较负面。
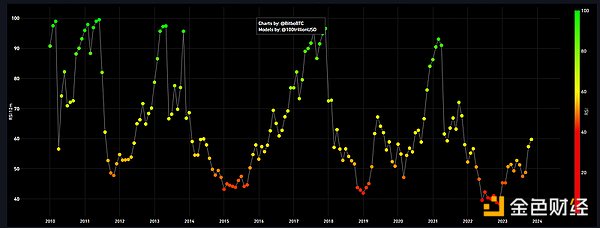
如何使用:
RSI 数值为 30 或以下(越接近红色)表明比特币已经超卖,或者可能很快就会面临超卖,适合考虑抄底。
RSI 数值为 70 或以上(越接近绿色)表明比特币正在超买,可能很快就会面临下跌,适合考虑卖出。
实时图表:https://charts.bitbo.io/monthly-rsi/
4、200 周移动平均热力图
指标介绍:该指标使用基于 200 周移动平均值的百分比增长的彩色热图。
根据 200 周移动平均线的逐月百分比增长,将一种颜色分配给价格图表。
从历史上看,在每个主要市场周期中,比特币的价格都在 200 周移动平均线附近触底。
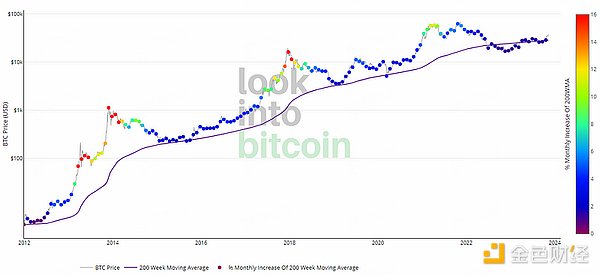
如何使用:
价格图表上的圆点颜色越靠近红色,代表市场过热,适合卖出;
越接近紫色,代表市场过冷,适合买入。
需要注意的是,在上轮牛市的顶部该指标失灵,这说明并不能完全依靠指标。指标只是我们辅助我们判断的一个工具,还需要对考虑很多其他因素进行判断。
实时图表:https://www.lookintobitcoin.com/charts/200-week-moving-average-heatmap/
5、CVDD
指标介绍:CVDD 全称为 Cumulative Value-days Destroyed,中文叫做累计销毁价值天数。
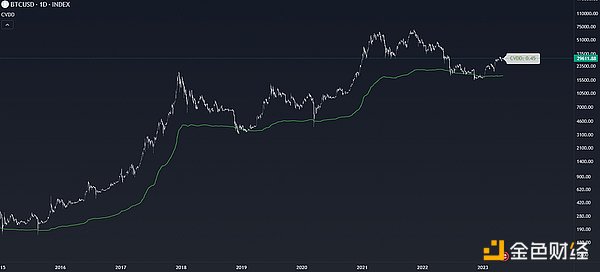
如何使用:当比特币价格触及绿线时,代表比特币价格被严重低估,是一个很好的买入机会。
实时图表:https://www.tradingview.com/script/3CEPlBsb-Cumulative-Value-Coin-Days-Destroyed/
总结
为了方便读者使用这些指标,我们将其制作成了图表。
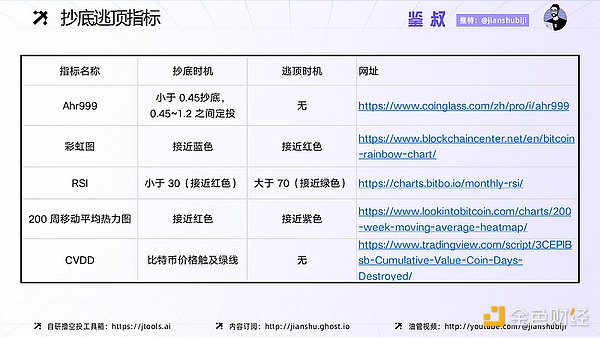
需要注意的是这些指标都是对比特币的买入和卖出的时机提供参考,并不代表其他代币也可以买入。
三、适合周期交易的策略
我们进行长周期交易的时候很容易出现下图这种情况,很多都是主观判断失误导致的,如果提前制定好策略就可以规避这种失误。

1、结合马丁格尔理论定投
我们首先了解一下“马丁格尔策略”以及“定投”的概念。
马丁格尔策略:马丁格尔策略最初是一种赌博策略,指的是在某个赌盘里,当每次输钱时就以 2 的倍数再增加赌金,直到赢钱为止。 假设在一个公平赌大小的赌盘,开大与开小都是 50% 的概率,所以在任何一个时间点上,我们输一次的概率是 50%,连输两次的概率是 25%,连输三次的概率 12.5%,连输四次的概率 6.25%,以此类推。玩的次数越多输的概率越小,理论上拥有无限的资金就不可能输。
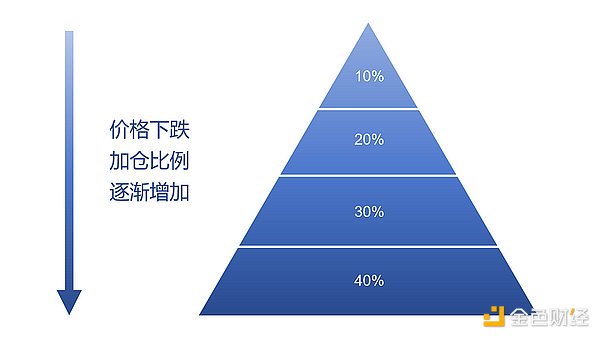
后来马丁格尔策略被应用到交易上,表现形式就是呈金字塔状加仓(马丁格尔策略可以细分为反向马丁、正向马丁以及头皮马丁,我们这里介绍的属于反向马丁)。
定投:定投是一种长期投资策略,通过定期按计划购买资产来平均分摊买入价格。该策略强调持续投资和长期持有,而不是试图通过短期市场波动来获取利润。
我们在使用上述指标时,这些指标不可能告诉我们精准的抄底和逃顶点位,只能判断在一个周期中相对的底部和顶部,而且我们不可能一直盯着指标看,这就是我们需要进行定投的原因。
如何制定策略:我们可以将马丁格尔策略的思想应用到定投上去,从而最大程度的降低我们的持仓均价。具体的策略可以这样的制定: 当前比特币价格为 $37000,假设从这个价格开始定投。根据上述指标可以判断当前比特币价格处于一个不高不低的位置,可以定投。我们将定投基准金额设置在 1000 元,定投频率设置在每周一次。在每周的定投中,如果价格上涨 $1000,我们定投的金额就减少 5%,如果价格下跌 $1000,我们定投的金额就增加 5%,当然前提是根据指标判断比特币价格还处在定投区间内。当比特币上涨超出这个范围之后就暂停定投计划,恢复到定投区间后再继续定投或是关注指标进行减仓。这些策略参数只是举例,策略参数不同收益率自然也不同,读者可以根据该流程自行制定定投策略。
缺点:马丁格尔策略号称“永不亏钱”,但是这是建立在交易标的不会归零且交易者资金无限大的前提下。所以马丁格尔策略不适合用于交易长尾资产,交易者资金量越大越能体现出马丁格尔策略的优势。
2、如何利用网格策略扩大收益
我们进行长周期投资时,手中持有比特币现货,存入去中心化借贷平台 APY 不高;如果存入交易所理财,APY 可观但有限额。想要提高资金利用率赚取额外收益,利用现货网格是个不错的选择。
现货网格策略:现货网格策略是一种在特定的价格区间中执行低买高卖的自动化策略,用户只需要设定区间最高价和最低价,确定好要细分的网格数,即可开始运行策略;如有需要,也可以预先设置好触发条件,待市场行情达到触发条件时,策略自动开始运行。策略会计算每个小网格低买高卖的价格,自动挂单,随着市场波动,不断地低吸高抛赚取波动带来的收益。
如何制定策略:一般来说网格策略适合震荡行情或震荡上行的行情,单边行情不适合使用网格策略。网格策略的缺点很明显,在价格涨或跌出设置区间时,就会卖飞或者接盘,这是有人叫它垃圾策略的原因。我们对网格策略进行了优化,我们不选择常规的非稳定币/稳定币的传统网格策略,我们选择 ETH/BTC 交易对搭配无限网格策略使用。
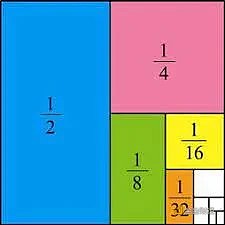
无限网格策略是普通网格策略的进阶版。无限网格在上涨行情中确保用户持有等值的计价货币资产。使用无限网格策略,用户无论卖多少次,还是拥有与上一个仓位等值的资产。举个例子,若价格初始值为 20000 USDT/BTC,用户拥有 1 个BTC,就拥有 20000 USDT 的资产在投资中。当价格涨到 40000 USDT/BTC,卖掉 1/2 个单位,用户还有 1/2 个单位,还是拥有 20000 USDT 的资产在投资中。当价格涨到 80000 USDT/BTC,再卖掉 1/4 个单位, 用户还拥有 1/4 个单位,我还是拥有 20000 USDT 的资产在投资中。无限网格没有一个确定的顶部区间,所以使用无限网格策略可以很好的规避因价格持续上涨造成的卖飞情况。
那为什么选择了 ETH/BTC 交易对?我们对网格策略进行优化的思路是如何规避价格超出网格区间带来的损失,但是由于网格策略自身的特性无法解决价格一直下跌所带来的亏损,我们只能对下跌带来的亏损进行减少。ETH/BTC 反应的是 ETH 和 BTC 之间走势的相对强弱,从周期的角度看,ETH/BTC 汇率在牛市的时候是震荡上行的趋势,在熊市的时候是震荡下行的趋势,ETH/BTC 交易对很好的匹配了无限网格这种适合长线慢牛的策略。而且在我们不仅能获取 BTC 本位的收益,而且可以获得 ETH 和 BTC 牛市上涨带来的收益。
四、总结
虽然本文介绍的指标和盈利方法都是以比特币作为投资标的,但是各位读者也可以举一反三,利用本文的抄底逃顶思路进行其他币种的投资。而且比特币价格的变化对其他的币种的走势也有指导意义,特别是市值靠前的主流币。
不论是什么指标都有其内在的不变性,虽然市场经常会出现黑天鹅,但是加密市场不会归零,只要不会归零有人参与,价格就会一直有涨跌,存在周期,不仅是对价值的预估也是时间上的检验。对于普通的投资者来说,只要利用好周期,吃到行业发展的红利就可以了。不只是在币圈,在其他行业也是一样的,倍数并不重要,持续能活下去才是最重要的,币圈缺的不是机会,而是不能持续参与下去。
This is the last article in our cycle series. The first three articles all analyze the cycle from a macro perspective. This article will mainly introduce how to use indicators to judge the top and bottom and how to optimize the investment strategy. The second and fifth indicators will teach you how to judge the top and bottom of the coin storage indicators. This indicator is introduced by Weibo users to create auxiliary bitcoin fixed investment users to make investment decisions in combination with the opportunity strategy. This indicator implies the rate of return of bitcoin short-term fixed investment and the deviation of bitcoin price from expected valuation. How to make money in a cycle How to use the guide to bottom-hunting and escape from the top when the index can bottom out? When the index is in between, it is suitable for fixed investment. When the index currency price is relatively high, it is not suitable for fixed investment. Real-time chart rainbow chart indicator introduction Rainbow chart is a long-term valuation tool of Bitcoin. It uses logarithmic growth curve to predict the potential future price direction of Bitcoin. It covers the rainbow ribbon at the top of the logarithmic growth curve channel, trying to highlight the market sentiment of each rainbow color stage when the price passes through it, thus highlighting the potential. Trading Opportunities Up to now, the price of Bitcoin has remained in the rainbow band of logarithmic growth channel. How to make periodic money? The last chapter is a guide to how to use the closer blue means that the price is closer to the bottom, the closer red means that the price is closer to the top. The real-time chart indicator introduces the relative strength indicator, which is an indicator to measure the speed and amplitude of bitcoin price changes. The score is calculated based on the performance of the previous month of the observed month to judge whether the market trend is in an overbought or oversold area. The stronger the strength of the sudden rise, the closer it will be, and the higher it will mean that the price change has been more positive in the past month. On the contrary, the stronger the strength of the decline, the closer it will be to the low value, which means that the price change is relatively negative. How to make money in the cycle is the end of the article. How to use the guide to bargain-hunting and escape from the top? The closer it is to red, the more it indicates that Bitcoin has been oversold or may soon face oversold. It is suitable to consider that the value of bargain-hunting is at or above, and the closer it is to green, which indicates that Bitcoin may soon face a Consider selling real-time charts. The weekly moving average heat map indicator is introduced. This indicator uses a color heat map based on the percentage growth of the weekly moving average. According to the monthly percentage growth of the weekly moving average, a color is assigned to the price chart. Historically, in every major market cycle, the price of bitcoin has bottomed out near the weekly moving average. How to make money in the cycle? The last chapter is a guide to how to use the dots on the price chart. The closer the color is, the red indicates that the market is overheated and suitable for selling. Close to purple means that the market is too cold for buying. It should be noted that the index failed at the top of the last bull market. This shows that we can't rely entirely on the index. It is just a tool for us to help us judge. We also need to consider many other factors. The introduction of real-time chart indicators is called the cumulative number of days of destruction value in Chinese. How to earn money in a cycle? The final guide to how to use the bottom-hunting and escape is a good buy. When the bitcoin price touches the green line, it means that the bitcoin price is seriously underestimated. In order to facilitate readers to use these indicators, we have made them into charts, how to make money in cycles, and the guide to the bottom-hunting and escape. It should be noted that these indicators are all references to the timing of buying and selling bitcoin, and do not mean that other tokens can also buy three strategies suitable for periodic trading. When we conduct long-term trading, it is easy to see the following figure. Many of these situations are caused by subjective judgment mistakes. If we make a good strategy in advance, we can avoid this kind of situation. How to make money in a cycle by mistake? A guide to the bottom-hunting and escape from the top combined with Martin Geer's theory, we should first understand Martin Geer's strategy and the concept of fixed investment. Martin Geer's strategy was originally a gambling strategy, which means that when we lose money every time in a certain gambling table, we will increase the gambling by multiple until we win. It is assumed that it is a probability that the gambling table of a fair gambling size is both big and small, so the probability of losing once at any point in time is the probability of losing twice in a row. It is the probability of losing three times in a row, the probability of losing four times in a row, and so on. The more times you play, the smaller the probability of losing. In theory, it is impossible to lose with unlimited funds. Later, Martin Geer's strategy was applied to trading in a pyramid shape. Martin Geer's strategy can be subdivided into reverse Martin, positive Martin and scalp Martin. We introduce here how to make money in reverse Martin's cycle. The final chapter, The guide to bottom-hunting and top-escaping, is a long-term investment strategy. By purchasing capital on a regular basis, it is a fixed investment strategy. The strategy emphasizes continuous investment and long-term holding rather than trying to make profits through short-term market fluctuations. When we use the above indicators, these indicators can't tell us the exact bottom and top of a cycle, and we can't always stare at the indicators. This is why we need to make a fixed investment. How to make a strategy? We can apply the idea of Martin Geer strategy to the fixed investment to maximize the journey. The specific strategy of reducing the average price of our positions can be as follows: the current bitcoin price is assumed to be fixed from this price. According to the above indicators, it can be judged that the current bitcoin price is in a position of neither high nor low, and we can set the benchmark amount of fixed investment in yuan and the frequency of fixed investment once a week. If the price rises, the amount of fixed investment will decrease, and if the price falls, the amount of fixed investment will increase. Of course, the premise is to judge bitcoin according to the indicators. The price is still in the fixed investment range. When the bitcoin rises beyond this range, the fixed investment plan will be suspended and resumed to the fixed investment range, and then the fixed investment will be continued or the index will be paid attention to to to lighten the position. These strategic parameters are just examples. Readers can make their own fixed investment strategies according to this process. Disadvantages Martin Geer strategy claims to never lose money, but this is based on the premise that the trading target will not return to zero and the trader's funds are infinite, so Martin Geer strategy is not suitable for exchange. The larger the amount of funds of traders with easy-to-long-tail assets, the better the advantages of Martin Geer's strategy. How to use grid strategy to expand the income? When we make long-term investment, we hold bitcoin in hand and deposit it in the decentralized lending platform. If we deposit it in the exchange for considerable financial management, but there is a limit, we want to improve the utilization rate of funds and earn additional income. Using spot grid strategy is a good choice. Spot grid strategy is an automatic strategy to implement low buy and high sell in a specific price range. Users only need to set the highest price and lowest price of the interval and determine the number of grids to be subdivided, and then 比特币今日价格行情网_okx交易所app_永续合约_比特币怎么买卖交易_虚拟币交易所平台
注册有任何问题请添加 微信:MVIP619 拉你进入群

打开微信扫一扫
添加客服
进入交流群
1.本站遵循行业规范,任何转载的稿件都会明确标注作者和来源;2.本站的原创文章,请转载时务必注明文章作者和来源,不尊重原创的行为我们将追究责任;3.作者投稿可能会经我们编辑修改或补充。