
比特币高涨:市场盈利浪潮席卷而来


摘要
目前比特币价格已突破4万美元的心理预期关口,年初至今的回报率高达140%。尤为吸睛的是其价格走势已经远远优于作为硬通货的黄金。
与之前的涨跌周期相比,就价格从熊市中恢复的时间以及自历史最高点的回撤这两个指标而言,比特币的回报情况与2015-17以及2018-22这两个周期的情况出奇地相似。
在这一年中比特币的涨势殊为可喜,绝大多数比特币投资者现在已经扭亏为盈,一些指标也进入了指示价格正处于“热切地上涨”的区间。
比特币在12月伊始就突破了4万美元的大关,这提示投资者们,对比特币而言2023年度将会是如何令人振奋的一个年份。在本文中,我们将比较2023年以及过去周期中比特币和其他数字资产的相对表现,以及投资者对市场本周的强劲表现所作出的反应与决策。
值得注意的是,本周黄金兑美元汇率也升至历史新高,超过2,110美元/盎司,兑所有法币汇率也同时创下历史新高。即便如此,比特币在面对黄金与美元的时候,依旧拥有更好的表现:
比特币对美元涨幅:141.6%
比特币对黄金涨幅:106.6%
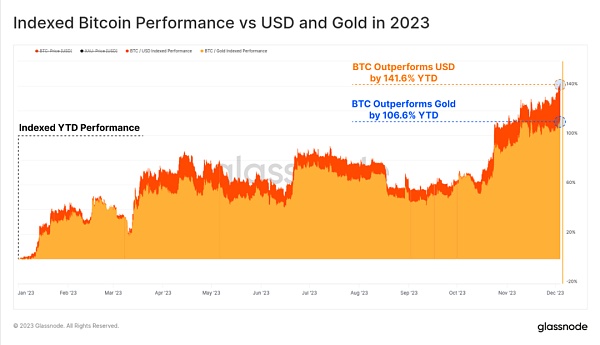
图1:比特币对美元/黄金的指数化表现
在今年的数字资产生态系统中,比特币表现最为强劲,而以太坊和其他数字资产的相对价格都是在最近几个月才出现繁荣的上升景象。但总的来说,这些数字资产在今年一年内的上涨趋势都令人欣喜。
比特币市值增长(橙色折线):141.6%
以太坊市值增长(蓝色折线):79.4%
其他数字资产(除以太坊和稳定币外)市值增长(红色折线):62.3%
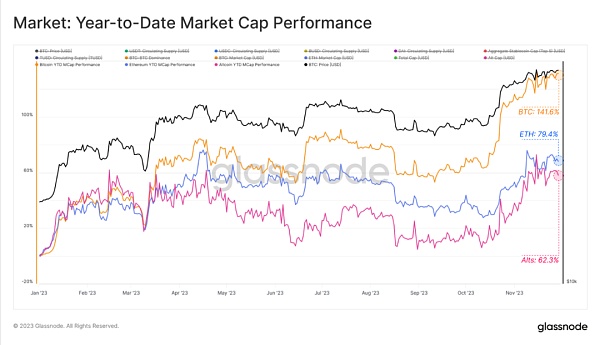
图2:2023年迄今不同数字资产的市场总值表现
自周期高点以来,BTC的市场表现也与2013-17和2017-21两个周期的表现惊人地相似。需要指出的是,在分析2017-21周期的时候,我们选择了2021年4月的市场顶部数据作为周期峰值。我们认为,从这个时间点入手,我们能更简洁清晰地比较每个周期的持续时间及其表现。这个选择是审慎的——我们使用了大量指标,这些指标共同表明该时间点市场情绪、采纳率和投资者信心都达到了顶峰。
2013-17(红色折线):自历史最高点回撤42%
2017-21(蓝色折线):自历史最高点回撤39%
2021-23(黑色折线):自历史最高点回撤37%
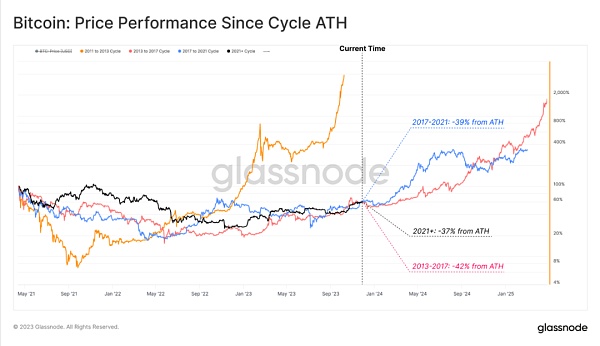
图3:每周期历史高点以来的比特币价格表现
如果我们从价格周期的另一极(周期低点)评估周期表现,我们同样会看到与2015-18和2018-22周期的相似之处。自2022 年11月FTX的最低点至今,比特币的价格上涨了146%,这实质上创造了过去两个周期中最佳的年度回报。在从熊市中恢复的大致等长的时间段内,比特币价格的整体表现与过去的周期非常一致。
2015-18(蓝色折线):增长119%
2018-22(绿色折线):增长128%
2022-23(黑色折线):增长146%
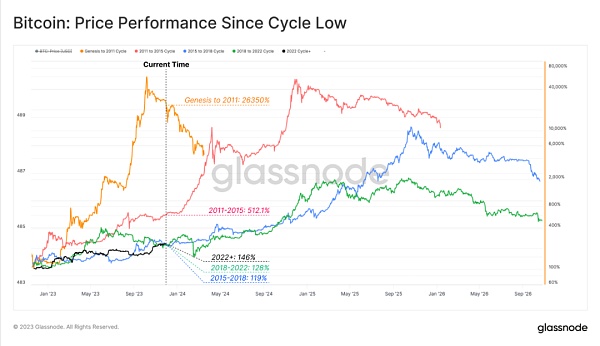
图4:自比特币周期低点以来的价格表现
我们用以评估这一上升趋势的相对强度的另一个方法是衡量从最近的局部高点回调的深度。2023年最深的回调幅度非常小:只有20.1%,这是历史宏观上升趋势中最小的价格回调。
在2016-17的牛市周期中,我们仍然可以看到自高点回落幅度超过25%的定期修正性回撤的情形。而到了2019年,价格甚至距当年7月的最高点产生了超过62%的回落。这表明2023年市场的潜在支撑水平与我们在此前分析的供应市场日益紧张的情形如出一辙。
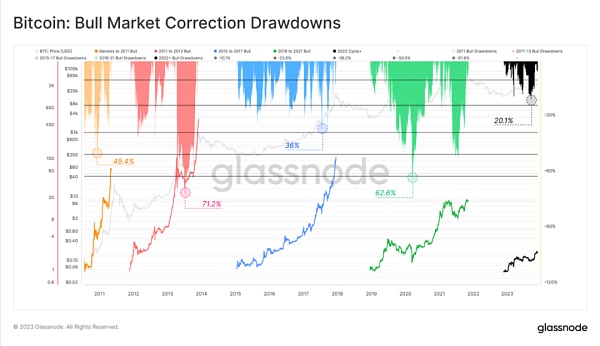
图5:比特币:牛市修正性回调幅度
交易活动的增加
尽管当前比特币的走势令人兴奋,但我们仍然必须审慎地考量与交易平台紧密关联的那些交易,以期发现市场活动和资本流向中的那些值得注意的偏差。尽管自今年伊始至今,比特币的表现非常强劲,但向交易平台存入资金的交易数量继续暴跌至多年来的低点,这与我们的直觉恰恰相反。
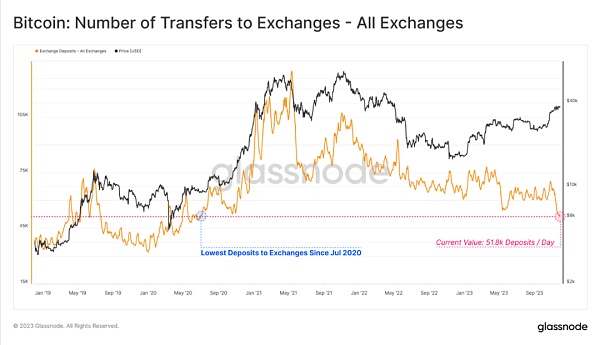
图6:与全部交易平台相关的所有交易
然而,当前周期的比特币交易逻辑与它们在此前周期中的表现均不相同:在对该周期内的交易逻辑做分析的时候,我们必须考虑涉及“铭文”的交易状况。换而言之,也就是我们必须在考虑到区块空间内有铭文相关买家这一前提条件下计算交易数。由于每个比特币的区块空间都是有限的,那么在铭文支付费用普遍较高的时期,其产生的高价格甚至可以使得在铭文支付费用较低的那段时间中的交易平台存款不足以比肩前者所产生的铭文费用。
如果我们看一下交易平台存款占所有交易的百分比(橙色部分),就会发现它们已从5月份的26%左右下降到今天的10%。然而,如果我们不考虑铭文交易的影响,仅将存款与非铭文交易进行比较(蓝色部分),我们会发现该百分比下降幅度较5月份早期更为平缓,仅仅将至约20%。
这表明投资者更愿意把他们的比特币资产花费在铭文相关的交易中,而非将它们放入交易平台里。
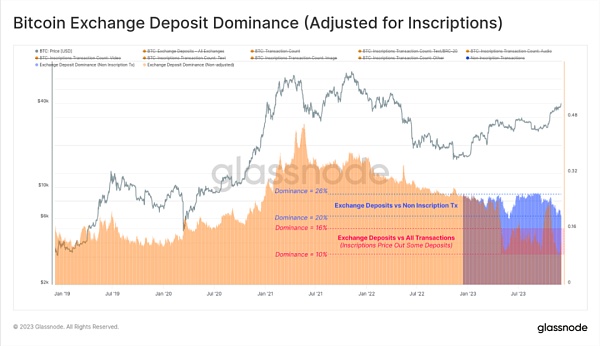
图7:比特币交易平台存款量
(以铭文相关交易费用为参数修正)
从链上交易量来看,我们不难发觉,年初至今流入和流出交易平台的资金已大幅增长,目前从9.3亿美元增长到超过30亿美元(上涨幅度约为220%)。这凸显了投资者越来越多地通过交易、积累、投机和使用其他服务来获取利润这一既定事实。
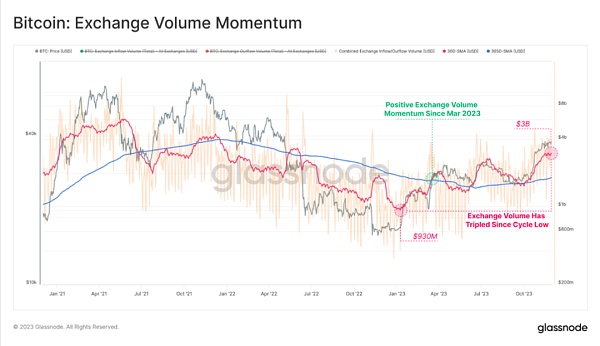
图8:交易平台存款总量的动能变化
随着交易量的大幅增长,当我们分析交易平台平均存款这一指标的时候,发现了一个值得注意的结果:该指标近期经历了一次大的反弹,目前该指标的高点已接近于此前每笔3万美元的峰值。
由此看来,目前主导交易平台存款的变动的因素是投资者正在通过交易平台转移越来越多的资金。与此同时,随着2024年1月这个ETF的关键日期的临近,越来越多的机构也在将兴趣转向数字资产市场。
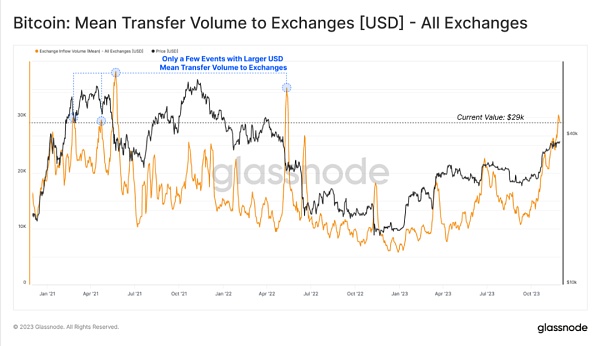
图9:交易平台平均存款
虽然进出交易平台的交易数量相对较低,但流入/流出的交易量已经占所有链上交易量的72.2%,与之前的历史最高值持平。考虑到近期投资者存款和取款的规模和数量不断增加,这更进一步说明了链上吞吐量的很大一部分与交易活动息息相关。
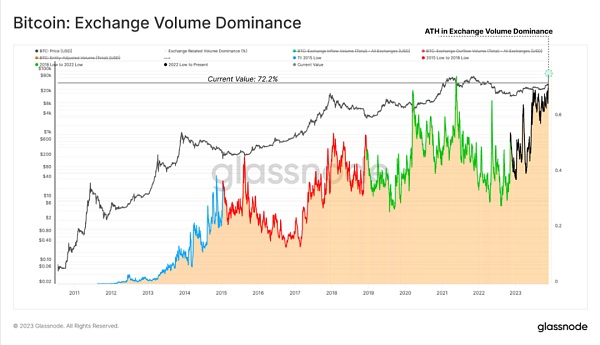
图10:交易平台比特币体量
市场盈利趋势增强
就目前而言,2023年的价格反弹已将比特币的价格推高至两个关键的链上水平之上:
1月的已实现价格已保证市场上的比特币已处于平均盈利状态。
10月的真实市场平均价格已使比特币的投资者达到人均获利。
及至目前,比特币的市场交易价格已经明显高于真实市场平均价格(3.1万美元/枚),大多数比特币持有者将看到他们的投资组合正从2022年的熊市中恢复过来。从历史经验上看,这标志着整个市场开始转向更加红火的牛市。
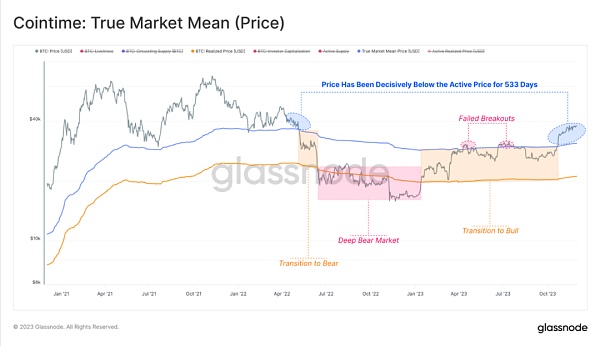
图11:比特币的真实市场均价
从长持投资者的角度来看,年初至今的上涨,其盈利的比特币在总持仓中的比例从56%上升至84%并突破了81.6%的历史平均值。
从历史上看,此前该指标每次向上突破历史平均值都预示着市场正在向着强劲上升的大牛市过渡,而这次该指标也指示了同样的事实。
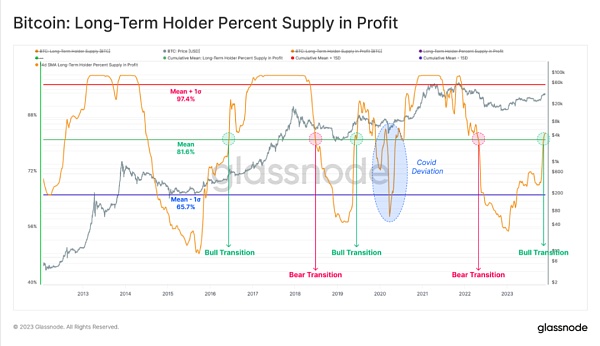
图12:长持投资者盈利的比特币占其总供应量的百分比
与之相对的,短持投资者群体几乎完全盈利,其持有的 95% 以上的比特币的基础成本低于当前现货价格。更进一步说,这一比例的当前值已高于该指标的长期+1标准差水平。与此相同的是,这一指标同样印证了当前比特币市场正处于高歌猛进的上涨趋势中。
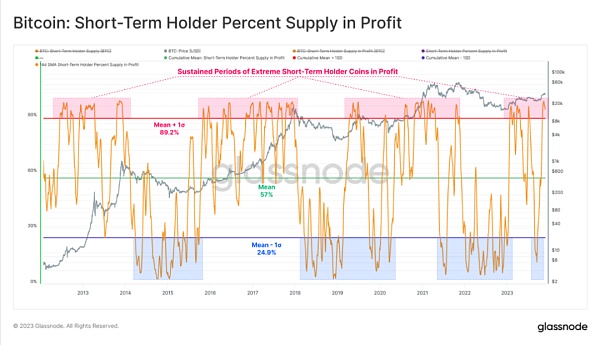
图13:短持投资者盈利的比特币占其总供应量的百分比
已实现的边际利润
在上文中,我们已指明在当前的比特币市场价格下,一部分的投资者已经确然盈利,那么下一个合乎逻辑的步骤是评估这些群体的获利和支出是否会随之出现明显的变化。为此,我们引入SOPR指标作为量化标准,该指标的意义是提供那些被锁定的比特币的平均盈亏倍率的视图,以便我们对该问题进行更好的分析。
在当前,多个群体的SOPR参数均高于1.0,这意味着平均每一个被卖出的比特币对于各个群体都是确然盈利的,其中:
广义市场(橙色):SOPR=1.09(平均利润9%)
短持投资者(红色):STH-SOPR=1.01(平均利润1%)
长持投资者(蓝色):LTH-SOPR=1.46(平均利润46%)
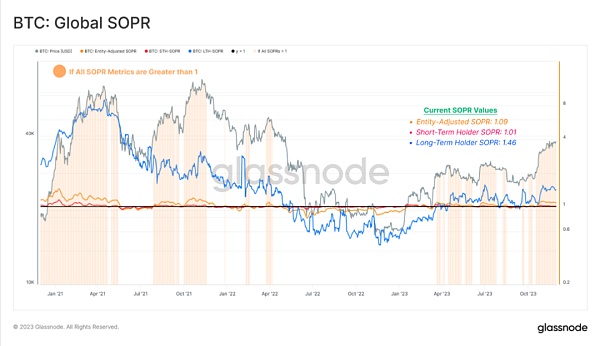
图14:比特币的全球市场SOPR
我们可以通过追踪所有三个SOPR参数均高于1.0的连续天数来进一步我们的研究。在目前,比特币的价格反弹已使这种情况持续了44天,这远长于该指标的17天的平均持续时间,也是自2021年11月比特币价格达到历史高点以来最长的持续时间。
总体而言,这表明绝大多数比特币持有者都在盈利,并且市场中有足够的需求来消化供应。
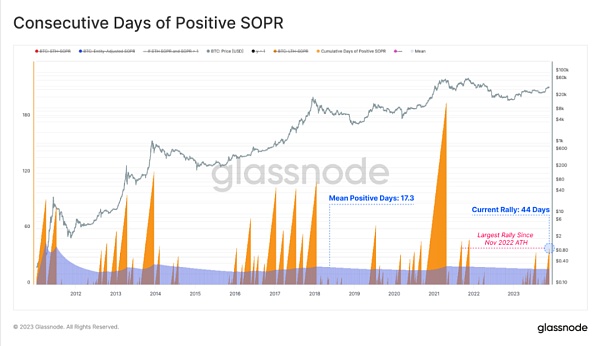
图15:正SPOR值的连续天数
在当前市场中锁定的以美元计价的已实现净利润已达到3.24亿美元/天,但仍比2021年牛市后期市场所经历的峰值(超过30亿美元/天)低一个数量级。
这表明,虽然市场表现强劲,且投资者已经获得了相当的盈利,但市场仍然处于牛市的早期,而非狂飙暴涨的牛市后期。
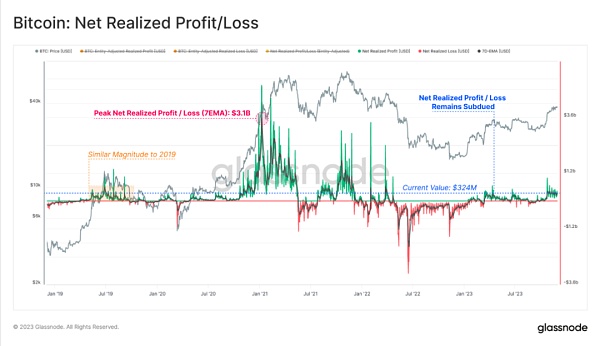
图16:已实现净盈亏
总结
在2023年,比特币仍旧是全球资产市场中表现最良好的资产之一。时至今日,比特币的价格已经较今年年初上涨了140%以上,这个涨幅较之黄金高了一倍多。且在整个数字资产行业中,相较于其他资产,比特币依然在整个数字资产业界中处于主导地位。
凭借如此强劲的表现,绝大多数比特币持有者现在已经扭亏为盈,其中一小部分人选择了出售他们所持有的资产以兑现这些收益。一些链上指标表明,最近的反弹已将市场推出“过渡性复苏区”,并继续推动它向着“热切的牛市”迈进。
At present, the price of bitcoin has exceeded the psychological expectation threshold of 10,000 dollars, and the rate of return is as high as the year-to-date one. What is particularly striking is that its price trend is far better than that of gold as a hard currency. Compared with the previous ups and downs cycle, the return of bitcoin is surprisingly similar to that of these two cycles in terms of the time for the price to recover from the bear market and the retracement from the highest point in history. In this year, the rise of bitcoin is particularly gratifying. Most bitcoin investors have now twisted. Some indicators have also entered the range indicating that the price is eagerly rising. Bitcoin broke through the mark of 10,000 US dollars at the beginning of the month, which reminds investors how exciting the year will be for Bitcoin. In this article, we will compare the relative performance of Bitcoin and other digital assets in the past and the past cycles, as well as investors' reactions and decisions to the strong performance of the market this week. It is worth noting that the exchange rate of gold against the US dollar has also risen to a new high in history this week. Even so, bitcoin still has a better performance in the face of gold and the dollar. Bitcoin's index performance against the dollar and gold is the strongest in this year's digital asset ecosystem, while the relative prices of Ethereum and other digital assets have only seen a prosperous rise in recent months, but in general, these digital assets are in this year. The upward trend in bitcoin market value growth orange broken line Ethereum market value growth blue broken line other digital assets divided by Taifang and stable currency market value growth red line chart the market value performance of different digital assets since the high point of the cycle is also strikingly similar to that of the two cycles. It should be pointed out that when analyzing the cycle, we chose the market top data of June as the peak of the cycle, and we think we can be simpler from this point in time. It is prudent to compare the duration of each cycle and its performance clearly. We use a large number of indicators, which together show that the market sentiment adoption rate and investor confidence have reached the peak at this time. The red broken line has retreated from the historical peak, the blue broken line has retreated from the historical peak, and the black broken line has retreated from the historical peak. If we evaluate the cycle performance from the historical high of each cycle, we will also see it. Similar to the cycle, the price of bitcoin has risen since the lowest point in June, which has essentially created the best annual return in the past two cycles. During the roughly equal period of recovery from the bear market, the overall performance of bitcoin prices is very consistent with the past cycle. The blue broken line growth, the green broken line growth and the black broken line growth chart show the price performance since the low point of the bitcoin cycle. Another method we use to evaluate the relative strength of this upward trend is to measure the recent local. The depth of the high point callback is very small, and only this is the smallest price callback in the historical macro upward trend. In the bull market cycle, we can still see the situation that the decline from the high point exceeds the regular correction retracement, and by the end of the year, the price even drops more than the highest point of the current month, which shows that the potential support level of the market in the year is exactly the same as the increasingly tight supply market we analyzed earlier. Figure Bitcoin bull market correction callback trading activities. Although the current trend of bitcoin is exciting, we must still carefully consider those transactions closely related to the trading platform in order to find those noteworthy deviations in market activities and capital flow. Although the performance of bitcoin has been very strong since the beginning of this year, the number of transactions that deposit funds into the trading platform has continued to plummet to a low point for many years, which is contrary to our intuition. However, the current cycle of bitcoin transactions is related to all trading platforms. Series and their performances in previous cycles are different. When analyzing the transaction logic in this cycle, we must consider the transaction situation involving inscriptions. In other words, we must calculate the number of transactions under the premise that there are buyers related to inscriptions in the block space. Because the block space of each bitcoin is limited, the high price generated by it can even make the payment in the period when the payment fee for inscriptions is generally high. Easy platform deposits are not comparable to the inscription fees generated by the former. If we look at the percentage of trading platform deposits in all transactions in orange, we will find that they have dropped from around January to today. However, if we only compare deposits with non-inscription transactions without considering the impact of inscription transactions, we will find that the percentage decline is more gentle than that in early January, and it is only about to reach, which shows that investors are more willing to spend their bitcoin assets on inscription. Instead of putting them into the trading platform, the amount of deposits on the bitcoin trading platform is revised with the inscription-related transaction costs as a parameter. From the point of view of the amount of transactions on the chain, it is not difficult to find that the funds flowing into and out of the trading platform have increased substantially since the beginning of the year, and the current increase rate is about $100 million, which highlights the established fact that investors are increasingly accumulating speculation through transactions and using other services to make profits. When we analyze the index of average deposit on trading platform, we find a noteworthy result. At present, the high point of this index is close to the previous peak of $10,000. It seems that the factor that dominates the change of deposit on trading platform at present is that investors are transferring more and more funds through trading platform, and at the same time, with the approaching of this key date, more and more institutions are turning their interest to digital capital. Although the number of transactions entering and leaving the trading platform is relatively low, the amount of transactions flowing in and out has been equal to the previous historical peak. Considering the recent increase in the scale and quantity of investors' deposits and withdrawals, this further shows that a large part of the throughput on the chain is closely related to trading activities. At present, the profit trend of the bitcoin volume market on the trading platform has increased, and the price rebound in 2008 has pushed the price of bitcoin to two key online levels. The realized price of bitcoin in the market has been guaranteed to be in an average profit state. 比特币今日价格行情网_okx交易所app_永续合约_比特币怎么买卖交易_虚拟币交易所平台
注册有任何问题请添加 微信:MVIP619 拉你进入群

打开微信扫一扫
添加客服
进入交流群
1.本站遵循行业规范,任何转载的稿件都会明确标注作者和来源;2.本站的原创文章,请转载时务必注明文章作者和来源,不尊重原创的行为我们将追究责任;3.作者投稿可能会经我们编辑修改或补充。