这些指标表明 比特币牛市仍有很大潜力
作者:Omkar Godbole,coindesk 翻译:善欧巴,比特币买卖交易网
追踪比特币区块链活动、矿工资金流向和200日移动平均线的关键指标表明,比特币远未被高估,2024年仍有可能继续上涨。
认知偏差,如锚定效应,可能会导致投资者在今年150%的大涨后,预期比特币价格会下跌。
Puell Multiple、MVRV Z-Score和Mayer Multiple等指标表明,比特币远未被高估,2024年仍有可能继续上涨。
比特币 (BTC) 作为市场价值领先的加密货币,今年以来飙升150%以上,远远超过了标准普尔500指数、黄金和美元等传统资产。
这可能会让一些投资者,尤其是那些没有经历过之前的加密货币牛市并“锚定”于2022年残酷熊市的人,直观地认为比特币被高估了,并预期未来几个月价格会下跌。锚定效应是一种认知偏差,会导致投资者在做未来判断时过度依赖最近或最初的数据。
想要接触比特币的传统金融投资者可能会成为锚定效应的受害者,直观地等待更便宜的入场价格。这是因为,在传统市场,资产很少会在不到一年时间内价值翻倍。此外,投资者通常容易受到损失厌恶的影响,这是过早退出赢利交易并长时间持有亏损头寸的一种认知行为。
尽管存在上述认知偏差,但三个关键指标——追踪比特币区块链活动、矿工资金流向和200日移动平均线——表明比特币仍有很大的上涨空间,盲目相信这些偏差可能会导致投资损失。让我们详细讨论一下这些指标。
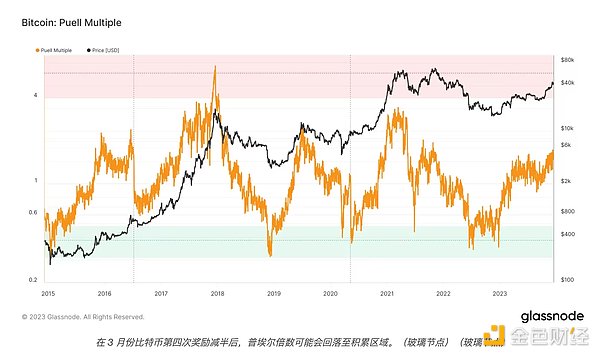
普尔倍数 (Puell Multiple)
普尔倍数衡量每日新产生的比特币的美元价值与该发行量365日移动平均美元价值之间的比率。这里的新产生指的是当前供应量,即挖出的或添加到网络的新币。自2020年初上次减半以来,矿工每天大约挖出900个比特币。
较高的读数表明,与年度平均水平相比,矿工目前的盈利能力很高,因此他们可能会更快地抛售其持有的比特币,加剧市场的看跌压力。较低的读数则相反。
历史上,高于4的读数与市场峰值重合,早期牛市周期甚至高达10。而低于0.5的倍数则暗示着市场底部。

根据Glassnode追踪的数据,截至发稿时,普尔倍数为1.53,远低于4以上的危险区域。
该指标可能会在明年早些时候比特币挖矿奖励减半后再次滑入积累区(低于0.5)。内置代码会将每区块的比特币发行量从6.5个BTC减半至3.25个BTC。
Blockware Intelligence的分析师在最新一期的周刊中表示:“由于补贴中发行的比特币数量实际上减半,该指标迅速回升的唯一途径就是比特币价格迅速上涨。”
分析师补充说:“下一次减半预计将在2024年3月进行。这并不遥远。”
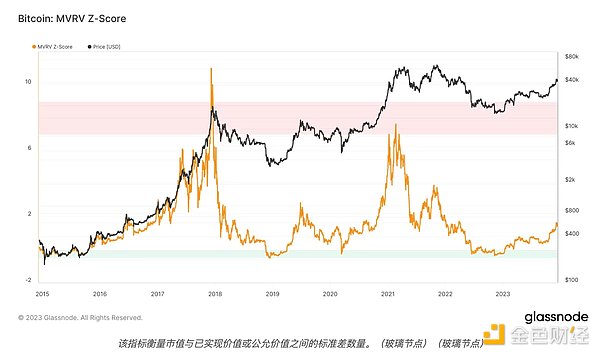
MVRV Z-score
比特币的市值-实现值(MVRV)比率的Z分数显示资产的市值与其实际或公允价值相差多少个标准偏差。
市值通过将流通中的代币总数与市场价格相乘获得。实现值是市值的一个变体,可以通过将最后一次在链上移动的比特币的价值除以流通中的硬币数量来计算。该指标排除了从流通中丧失的硬币,并据说反映了网络的公允价值。

截至目前,Z分数为1.6,表明加密货币离被高估还有一定距离,可能会在明年继续上涨,正如一些分析师所预期的那样。
从历史数据来看,Z分数超过八表明被高估并标志着牛市顶部,而负值表明打折价格并标志着熊市底部。
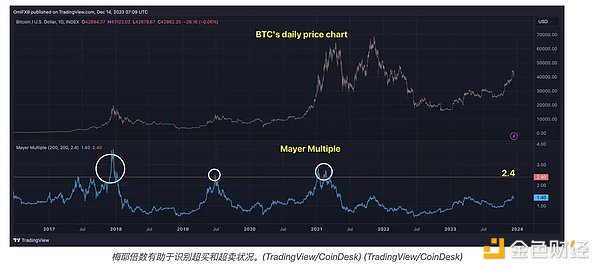
Mayer Multiple
Mayer Multiple 由比特币投资者兼播客主持人 Trace Mayer 开发,衡量比特币当前市场价格与 200 天简单移动平均线 (SMA) 之间的差异。
该指标通过将当前市场价格与其 200 天移动平均线进行比较,帮助识别超买和超卖状况。假设是,在长期看涨/看跌趋势推动倍数高于 2.4/低于 0.5 后,市场将恢复到其均值或 200 日移动平均线。
截至撰写本文时,梅耶倍数为 1.404,这意味着比特币价格 42,937 美元是其 200 天移动平均线(30,563 美元)的 1.4 倍。
换句话说,在我们可以说比特币相对于 200 日移动平均线超买之前,它还有很大的上涨空间。200 日移动平均线是最广泛跟踪的长期趋势指标之一。根据技术分析,一旦资产价值跌破 200 日移动平均线,则资产被认为处于牛市,反之亦然。

The key indicators of tracking the miners' capital flow and daily moving average of bitcoin blockchain activities by Shanouba Bitcoin Trading Network show that bitcoin is likely to continue to rise in years far from being overvalued. Cognitive biases such as anchoring effect may lead investors to expect bitcoin prices to fall after this year's surge, and other indicators show that bitcoin is likely to continue to rise in years far from being overvalued. As a cryptocurrency with leading market value, bitcoin has soared above this year, far exceeding Standard & Poor's. The index of traditional assets such as gold and US dollar may make some investors, especially those who have not experienced the previous cryptocurrency bull market and anchored in the cruel bear market in 2008, intuitively think that Bitcoin is overvalued and expect the price to fall in the next few months. The anchoring effect is a cognitive bias, which will lead investors to rely too much on recent or initial data when making future judgments. Traditional financial investors who want to contact Bitcoin may become victims of the anchoring effect and intuitively wait for cheaper prices. Admission price This is because in the traditional market, assets rarely double in value in less than a year. In addition, investors are often easily affected by loss aversion. This is a cognitive behavior of prematurely withdrawing from profitable transactions and holding loss positions for a long time. Despite the above cognitive biases, three key indicators track the flow of bitcoin blockchain activities, miners' funds and the daily moving average show that Bitcoin still has a lot of room for growth. Blindly believing that these deviations may lead to investment losses, let us elaborate. Let's discuss these indicators: Poole's multiple. Poole's multiple measures the ratio between the daily dollar value of newly generated bitcoins and the daily moving average dollar value of the circulation. Here, the new generation refers to the current supply of new coins dug up or added to the network. Since the last halving at the beginning of the year, miners have dug up about 10 bitcoins every day. The higher reading indicates that miners' current profitability is high compared with the annual average, so they may sell their bitcoins more quickly and aggravate the market. On the contrary, the readings with lower downward pressure coincide with the peak value of the market. The multiples of even higher and lower in the early bull market cycle suggest that the Poole multiple at the bottom of the market is a dangerous area far below the above according to the tracked data at the time of publication. This indicator may slide into the accumulation area again after the bitcoin mining reward is halved early next year. The bitcoin circulation in each block will be halved from 0 to 0. Analysts said in the latest issue of the weekly magazine that due to subsidies, The number of bitcoins issued has actually halved. The only way for this indicator to rise rapidly is that the price of bitcoins has risen rapidly. Analysts added that the next halving is expected to take place in May, which is not far away. The score of the realized value ratio of the market value of bitcoins shows how many standard deviations the market value of assets differs from its actual or fair value. The realized value obtained by multiplying the total number of tokens in circulation with the market price is a variant of the market value. The value is calculated by dividing by the number of coins in circulation. This indicator excludes coins lost from circulation and is said to reflect the fair value of the network. Up to now, the score shows that cryptocurrency is still far from being overvalued and may continue to rise next year, as some analysts expected. From the historical data, a score of more than eight indicates that it is overvalued and marks the top of the bull market, while a negative value indicates the discount price, and marks the bottom of the bear market. Bitcoin investors and podcasters have developed and measured bitcoin. The difference between the current market price and its daily moving average This indicator helps to identify the overbought and oversold conditions by comparing the current market price with its daily moving average. It is assumed that the market will return to its average or daily moving average after the long-term bullish and bearish trend is driven by a factor higher than or lower than that. As of the writing of this article, the Meyer multiple is, which means that the bitcoin price of USD is twice that of its daily moving average. In other words, we can say that Bitcoin is overbought relative to its daily moving average. Before, it still had a lot of room to rise. The daily moving average is one of the most widely tracked long-term trend indicators. According to technical analysis, once the value of assets falls below the daily moving average, assets are considered to be in a bull market, and vice versa. 比特币今日价格行情网_okx交易所app_永续合约_比特币怎么买卖交易_虚拟币交易所平台
注册有任何问题请添加 微信:MVIP619 拉你进入群

打开微信扫一扫
添加客服
进入交流群
1.本站遵循行业规范,任何转载的稿件都会明确标注作者和来源;2.本站的原创文章,请转载时务必注明文章作者和来源,不尊重原创的行为我们将追究责任;3.作者投稿可能会经我们编辑修改或补充。


