2023年链上回顾:十月带来加密生机


不知不觉,2023年已经快要结束了。本文我们将对今年链上发生的变化进行一次系统性的概括与浏览,探讨 2023 年比特币、以太坊、衍生品和稳定币的格局是如何演变的,以及它们是如何奠定了令人兴奋的未来之路。
摘要
对于加密行业来说,2023 是令人难忘的一年,比特币上涨超过 172%,且修正幅度不到 20%,大量资产流入 BTC、ETH 和稳定币。
在2023年,加密市场的几个重要的技术和链上定价模型突破历史新纪录,10月是机构资本流动的关键节点。
目前,长期持有者持有的比特币供应量几乎达到历史最高水平,绝大多数比特币现在都处于盈利状态。
市场结构正在发生重大变化,例如 Tether 重新确立了稳定币的主导地位、CME 期货首次超越了币安,以及期权市场的显著增长。
2023 是令加密行业难忘的一年,比特币上涨超过 172%。其他数字资产表现也相当强劲,以太坊和大部分山寨币的市值增长了 90% 以上。
可以看出,比特币的主导地位不断上升,这通常被视为市场从长期熊市(例如 2021-22 年)中复苏的迹象。尤其是以太坊,尽管上海升级成功发布以及 L2 生态系统发展,但相对比特币而言,以太坊的起步有些缓慢,ETH/BTC 比率跌至 0.052 左右的多年低点。
尽管数字资产全年的表现均明显优于股票、债券和贵金属等传统资产,但大部分的涨幅都是来自 10 月底以后的反弹。10月后比特币首先突破了 3 万美元的心理重要价格水平,以及许多重要的价格关口。
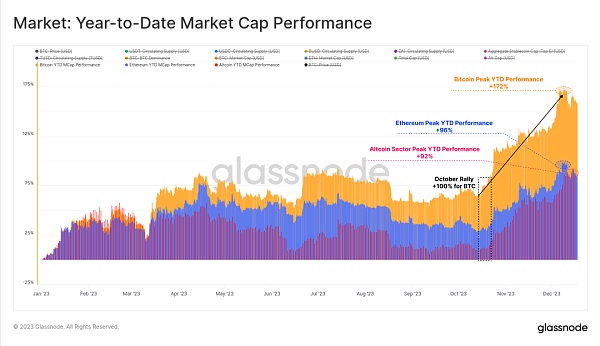
图1:年初至今的市值表现
回调幅度不明显
2023 年另一个独特表现是比特币所有价格回调的深度都非常浅。从历史上看,比特币在熊市复苏和牛市上升趋势期间通常会从局部高点回调至少 25%,甚至很多时期超过50%。
然而,2023 年的最深回调收盘价仅比局部高点低 20%,表明该点位有买方支撑。
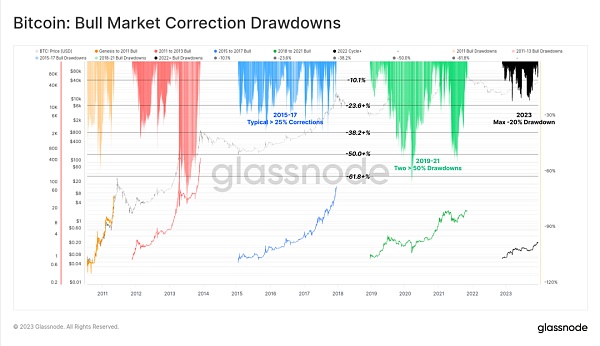
图2:比特币:牛市修正
以太坊的调整深度也相对较浅,最深的调整是在一月初达到40%。尽管相对于比特币表现较为疲软,但这也描绘了一个建设性的背景,即Merge导致的以太坊供应量减少满足相对弹性的需求。
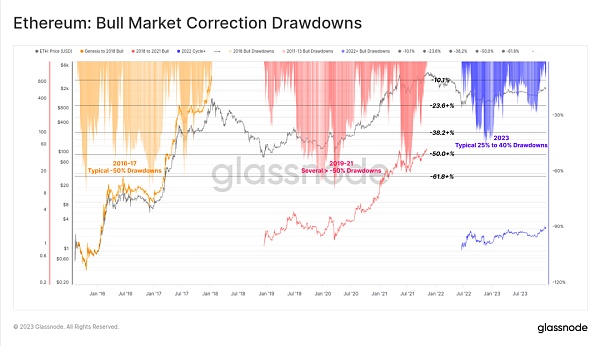
图3:以太坊:牛市修正
2022 年熊市的残酷程度略低于 2018-20 年熊市周期,大多数主流数字资产从 2023 年开始均较其 ATH 下跌 75%,不过近期的强劲表现弥补了大部分损失。当前主流数字资产相较于其 ATH 回落 40%(BTC)、55%(ETH)、51%(山寨币,不包括 ETH 和稳定币)和稳定币供应量(24%)。
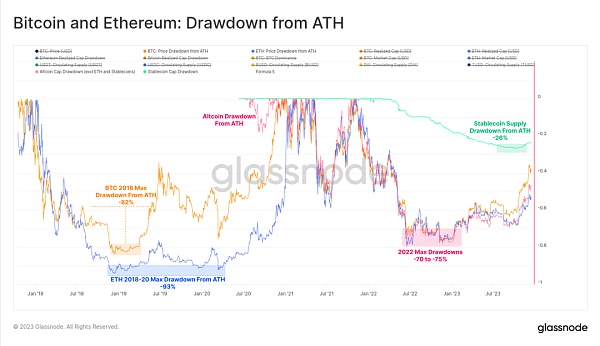
图4:比特币和以太坊:ATH回落
从链上角度来看,BTC 和 ETH 的已实现市值可以跟踪各自资本流动情况。2022 年熊市期间的总已实现市值下降达到了与之前周期相似的水平,BTC净资本流出18%,ETH 净资本流出 30%。
然而,今年的资本流入恢复速度要慢得多,比特币已实现市值达到 ATH 已经是 715 天前了。相比之下,在历史周期中,已实现市值的完全恢复大约需要 550 天。
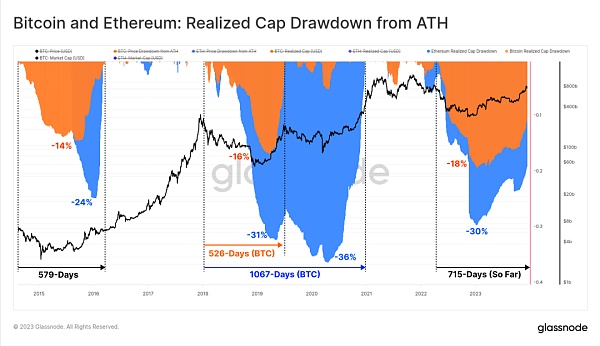
图5:比特币和以太坊:已实现市值从ATH回落
10月是2023年的重大转折点
2023年,比特币市场突破了众多技术和链上定价模型,所有这些表现都有助于我们了解其强劲势头。
2023年始于 1 月份的轧空,将比特币推至已实现价格(橙色)之上,该价格自 2022 年 6 月以来一直阻止价格上涨。这次上涨也突破了 200D-SMA(蓝色),直到三月在 200W-SMA (红色)遇到阻力后。
8 月,比特币价格继续在 200D-SMA(蓝色)和真实市场平均价格(绿色)之间盘整,进入比特币历史上波动最小的时期之一。不久之后,比特币价格在一天内从 29,000 美元跌至 26,000 美元,并低于上述两个长期技术价格指标的平均值。
10 月份的反弹真正改变了市场状态,价格开始回升,突破了 3 万美元的关键心理水平。此后,比特币达到了 4.45 万美元的年度高点。
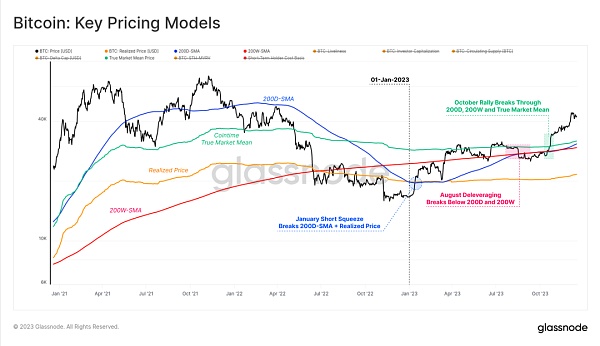
图6:比特币:关键价格指标
本文我们反复提到一个关键节点:自 10 月底以来资本流动、市场活跃度和价格表现都在加速。随着比特币价格突破了 3 万美元的关键心理水平,我们可以认为当前市场是从“不确定的复苏”阶段到“热情的上升趋势”的过渡。
值得注意的是,10月份的反弹突破了两个重要的技术指标水平,这两个技术指标水平在之前的周期中描绘了这种转变:
技术市场中点(The technical market mid-point):作为熊市早期的支撑位和熊市后期的阻力位的宏观价格水平。在本轮熊市中,30,000 美元是最后一个主要支撑区域,跌破之后出现了一系列投降式抛售,最终导致 FTX 崩溃。
真实市场平均价格(The Cointime True Market Mean Price):反映活跃投资者的基础成本。
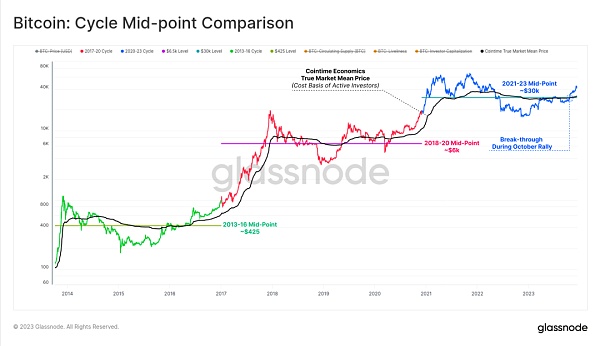
图7:周期中点比较
我们还可以明显看到“比特币熊市信号中恢复”,因为自 10 月份以来,所有八个指标(如下图)都进入了正值区域。2023 年的大部分时间里,各指标数据参差不齐,表现出与 2019-20 年期间非常相似的特征。
八个指标现已进入正值,这表明了比特币市场已进入与弹性上升趋势相关的积极区域。
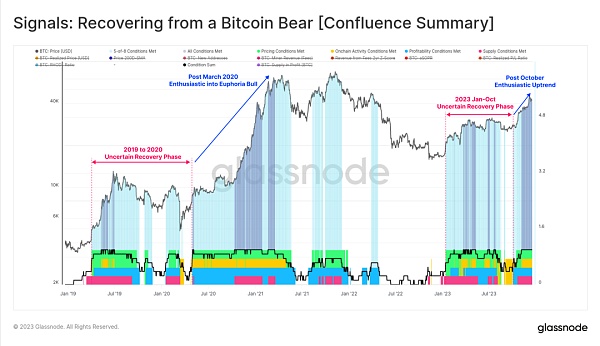
图8:信号:从比特币熊市中复苏(汇总)
交易量、费用增长和铭文出现
我们可以看到,10月之前比特币的交易量相对停滞,10 月份的上涨促使比特币的交易量翻了一番,从每天 24亿美元增加到每天超过 50亿美元,这是自 2022 年 6 月以来的最高水平。这再次向我们证明了“10 月份在某种程度上是市场阶段性转变”。
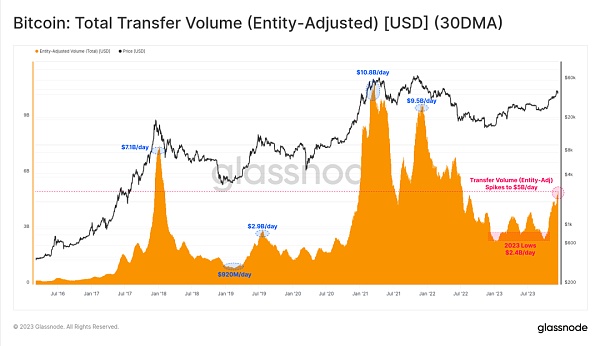
图9:比特币:总交易量(实体调整)(30日均线)
2023年比特币和以太坊的交易平台流入和流出量有所增加,表明市场对现货交易的兴趣增加。值得注意的是,比特币交易量的增长速度明显快于以太坊交易量,这与比特币主导地位不断上升的观察结果一致。在长期熊市之后,我们常常看到的是比特币带领投资者信心走出低迷情绪,下面这张图表有助于直观地展示这一现象。
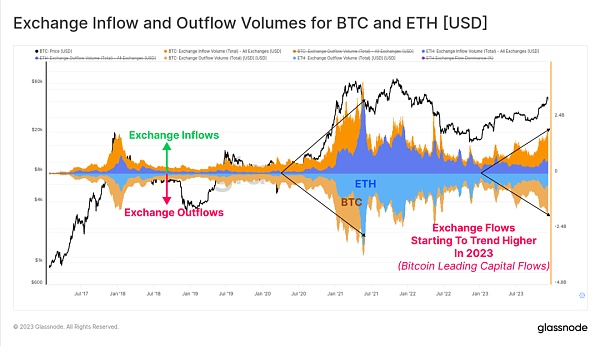
图10:比特币和以太坊的交易平台流入流出
2023年,比特币交易数量创下历史新高,这主要是由于 Ordinals(序数)和 Inscriptions(铭文)的出现。这些交易将文本文件和图像等数据嵌入交易的签名部分。
因此,我们现在可以评估两种类型的比特币交易:
(橙色)总交易计数(未过滤)。
(蓝色)比特币交易量达到了多年来的新高,几乎达到了历史最高点 372,500笔/天。
(红色)铭文交易在比特币交易的基础上每天额外增加 175,000 至 356,000 笔交易。
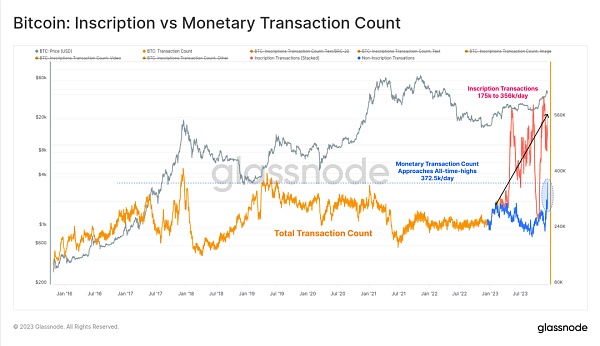
图11:比特币:铭文vs 比特币交易量
绝大多数铭文往往是基于文本的,与称为 BRC-20 的新资产(蓝色)标准相关。在高峰期,比特币链上每天的铭文交易数量超过 30 万,远远超过了 4 月份基于图像的铭文(橙色)每天 17.2 万的峰值(图片体积更大,因此随着手续费用的增加,成本更高)。
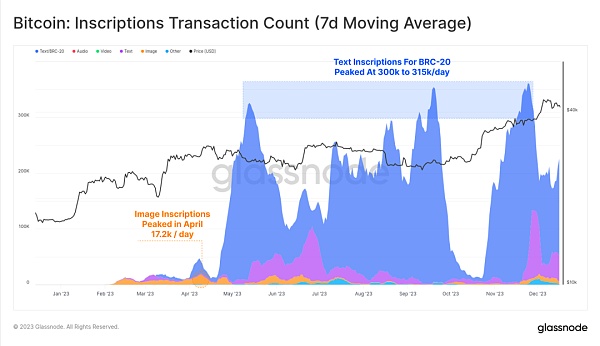
图12:比特币:铭文交易数量(7天移动平均)
铭文——比特币区块空间的新买家,使开采者的费用收入大幅增加,2023 年有几个区块支付的费用甚至超过了 6.25 BTC 的区块奖励。今年出现了两次费用大幅上涨,目前费用约占开采者收入的四分之一。这与 2017 年和 2021 年牛市的欣快阶段相当。
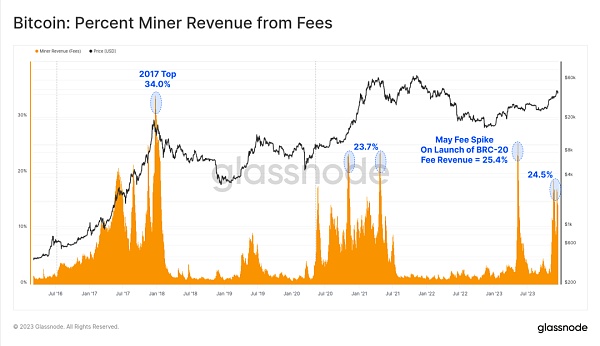
图13:开采者费用收入占比
有趣的是,虽然铭文交易量约占已确认交易的 50%,但令人惊讶的是,它们仅占用区块空间的 10% 至 15% 左右。这是因为文本文件较小以及与 SegWit 的数据折扣。
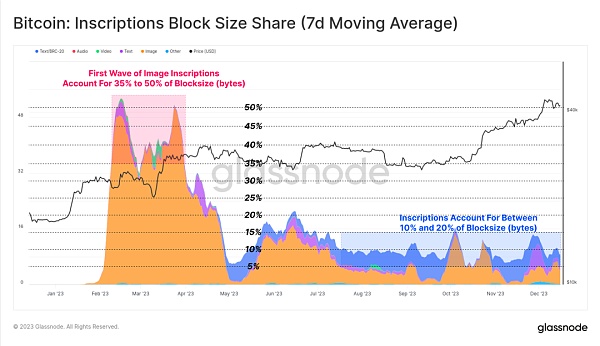
图14:比特币:铭文区块大小占比(7天移动平均)
今年,铭文贡献了开采总交易费收入的 15% 至 30%。这直观的表现了 SegWit 数据折扣的特征,其中铭文交易消耗了一小部分区块空间(以字节为单位),支付了相当大比例的费用,但也占所有已确认交易的一半左右。
实际上,铭文和 SegWit 数据折扣允许开采者将更多交易放入相同的最大区块中,从而支付更多费用。如果市场对铭文的需求持续存在,可能将改善开采者的收益,特别是在第四次减半即将到来的情况下。
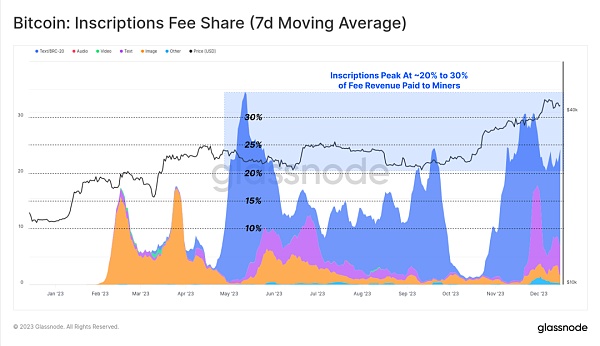
图15:比特币:铭文费用占比(7天移动平均)
锁定在跨链桥和质押的以太坊
对于以太坊来说,今年链上活动有点低迷,10 月再次成为一个显著的拐点。
链上活跃地址相对稳定,约为 39 万/天
交易量最近从 97 万笔/天增加到 111 万笔/天
ETH 交易量已从 $18亿/天增加到 $29亿/天
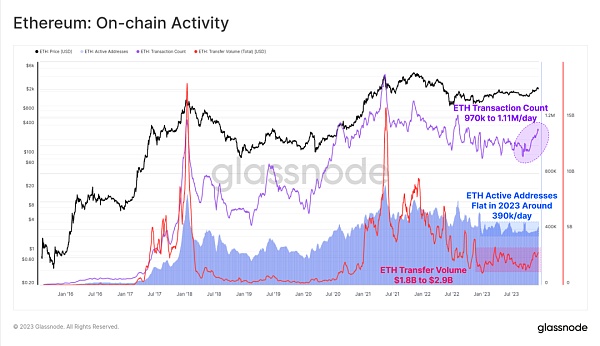
图16:以太坊:链上活动
虽然 ETH 价格表现落后于大部分数字资产,但其生态系统仍在不断扩大、成熟和发展。特别是,锁定在不断扩大的 Layer-2 区块链中的总价值增加了60%,其中超过 120亿美元锁定在跨链桥中。
这些 L2 链正在寻求扩展以太坊区块空间,同时将其数据和计算结果锚定到以太坊主链中以维护其安全性。
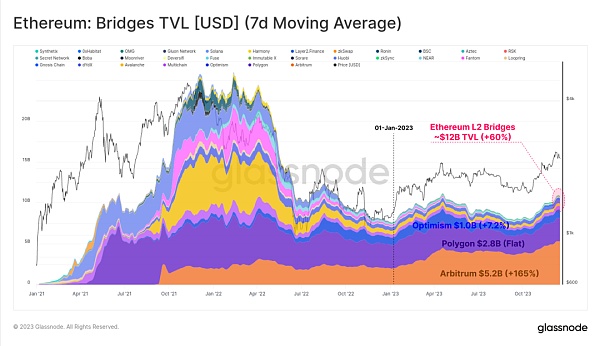
图17:以太坊:跨链桥中锁定的资产(7天移动平均)
以太坊的另一个关键增长领域是通过PoS质押的 ETH 总量。2023年以来,ETH 的质押数量增长了 119%,目前锁定在质押协议中的 ETH 数量已超过 3463.8 万枚。上海升级也在 4 月份成功推出,自 2020 年 12 月信标链推出,首次允许质押者提现,并重新洗牌流动性质押提供商。
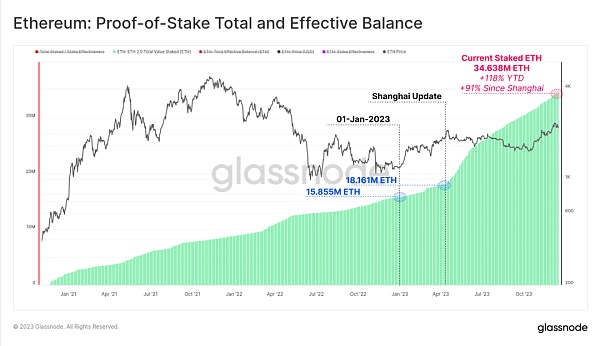
图18:以太坊:PoS总有效质押余额
分片链如何与信标链连接?
尽管比特币的价格表现让很多人蠢蠢欲动,但很大一部分比特币仍处于休眠状态,并在投资者钱包中达到长期持有状态。在 1,957.4 万枚 BTC 的总流通供应量中,超过 1,490 万枚(76.1%)被存放在交易平台之外,并且在超过 155 天的时间里没有交易,今年迄今增加了 82.5 万枚 BTC。这也使短期持有者供应量达到 231.7 万 BTC 的历史最低水平。
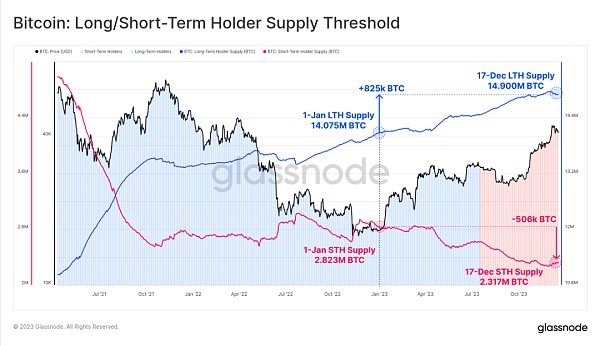
图19:比特币:长/短期持有者供应
随着市场反弹,绝大多数投资者的资产已经恢复“盈利”,无论是由于交易,还是价格上涨至基础成本之上。下图显示了“亏损”的资产总量如何下降至 190 万枚 BTC 左右,其中大部分由长期持有者持有,他们是在 2021 年高点附近买入的。
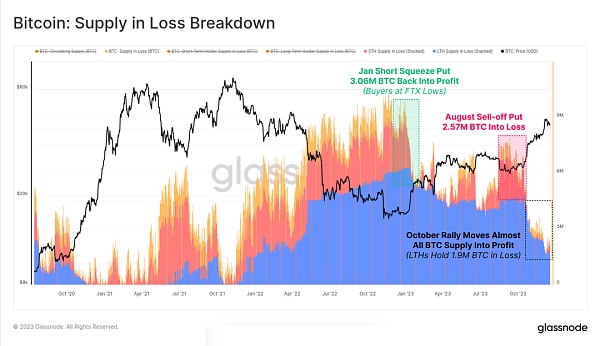
图20:比特币:处于损失状态的资产
另一方面是,10 月份的反弹使“盈利”供应量占比高于历史平均水平,占流通供应量的 90% 以上。鉴于 2023 年初时超过 50% 的供应量处于“亏损”状态,这是历史上最快的复苏之一(仅次于 2019 年的反弹)。
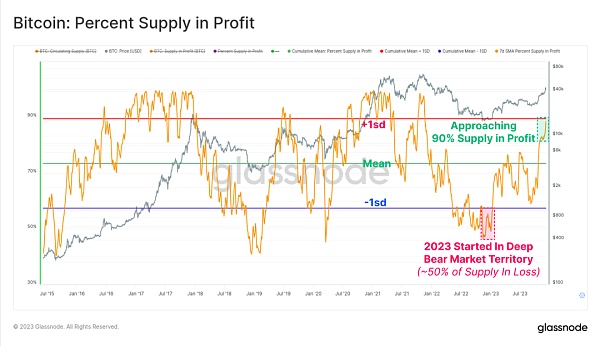
图21:比特币:“盈利”供应占比
下图直观地展示了自 2015 年以来每年的盈利供应百分比变化。虽然按年份划分并不完全合适,但每四年的比特币周期让我们发现了一些有趣的规律:
(橙色)熊市/复苏阶段,由于比特币在低点附近投降抛售,大量比特币回到盈利状态,利润供应量增幅最大。
(蓝色)早期牛市,上升趋势使大部分资产开始盈利,并反弹至新的最高点。
(绿色)欣快的后期牛市,市场处于 ATH 水平,所有代币都已经盈利,市场接近枯竭。
(红色)市场见顶后的主要熊市,大量资产陷入亏损。
虽然结构简单,但该框架展现了 2015-16 年、2019-20 年和 2023 年迄今取得的进展之间的相似之处。
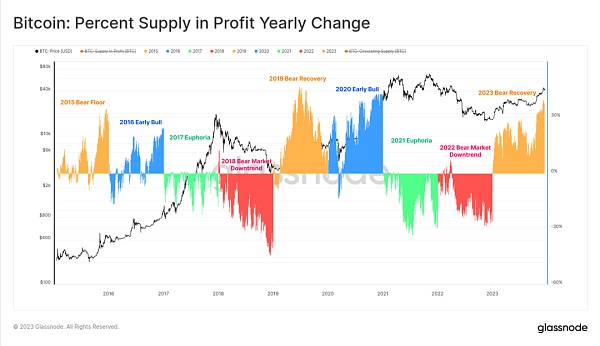
图22:每年的盈利供应占比
最后我们可以讨论投资者的盈利能力,2023 年将长期持有者、短期持有者和普通持有者从无利可图转变为适度盈利的状态。每个群体的 NUPL 指标虽尚未达到令人振奋的高点,但也明显高于各自群体的基础成本水平。
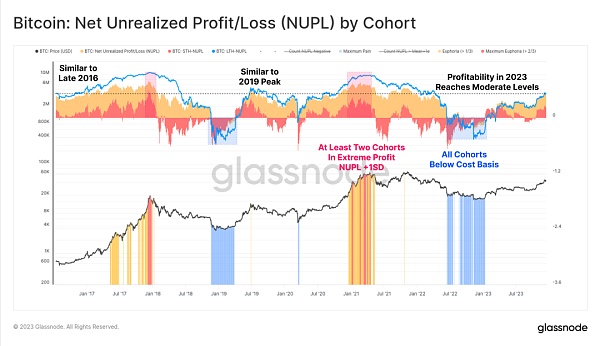
图23:各群体的未实现损益
日趋成熟的衍生品市场
2020-23 年周期的一个显著特征是期货和期权市场成为价格敞口和流动性的首选之地。事实证明,2023 年是这一发展过程中的重要一年,因为期权市场的未平仓合约规模已发展到与期货市场相当甚至超过期货市场。
目前,两者的未平仓合约都在160亿美元到 200亿美元之间,而 Deribit 继续在期权领域占据主导地位 (90%+)。说明机构投资者对比特币的兴趣日益浓厚,因为交易者和头寸通常会利用期权市场来部署更复杂的交易、风险管理和对冲策略。
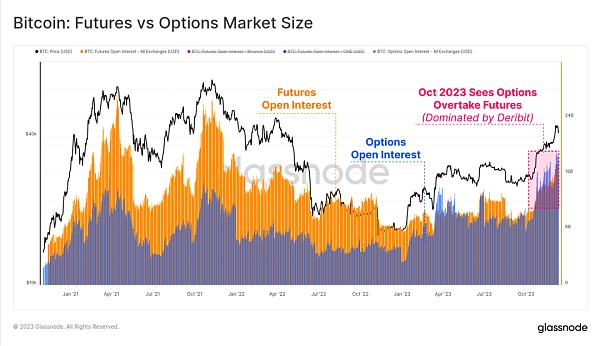
图24:比特币:期货和期权市场规模
值得注意的是,在期货市场内也出现了主导地位的转变,受监管的芝加哥商品交易平台 (CME) 持有的未平仓合约历史上首次超过离岸交易平台币安 (Binance)。10月份似乎再次成为这一转变的重要时刻,它彰显了着机构资本的涌入。
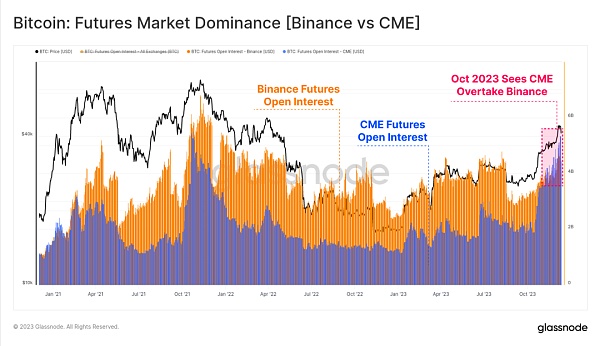
图25:期货市场主导地位(币安vs CME)
10 月份 BTC 和 ETH 的期货交易量均有所上升,每日总交易量为 520亿美元。比特币合约占交易量的 67% 左右,而以太坊合约占 33%。
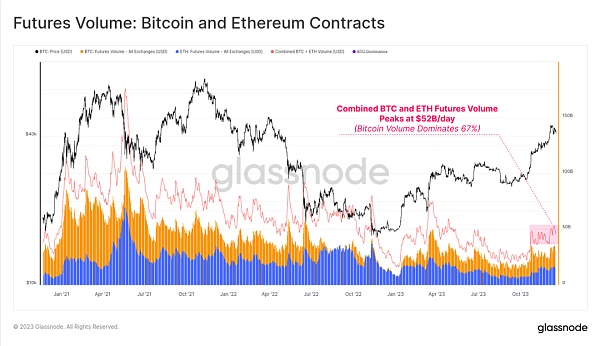
图26:期货价值:比特币和以太坊合约
期货市场中的正向套利期权收益率在一年中经历了三个不同的阶段,这也讲述了资本流入该领域的历程:
1 月至 8 月,收益率波动在 5% 左右。这在很大程度上与短期美国国债收益率一致,考虑到交易的额外风险和复杂性,该产品相对缺乏吸引力。
8 月至 10 月,在抛售至 26,000 美元后,收益率低于 3% ,而且波动性出人意料地低。
10 月起,收益率突破 8%。随着期货基准目前保持在高于美国国债300个基点的水平,做市商资本现在有了重返数字资产领域的动力。
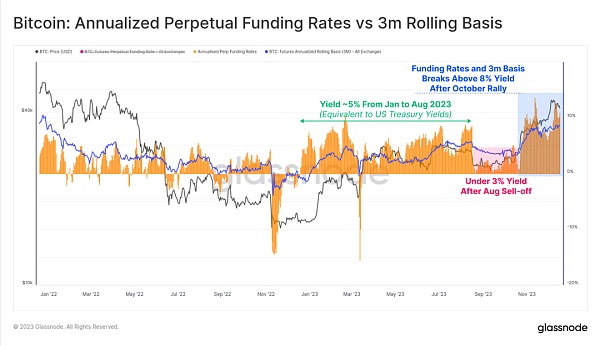
图27:比特币:年化永久融资利率与3个月滚动基准
稳定币供应量回升
上一个周期的一个相对较新的现象是稳定币在市场结构中发挥的巨大作用,成为交易者的首选媒介资产和市场流动性的主要来源。
自 2022 年 3 月以来,稳定币总供应量一直在下降,较峰值下降了26%,成为市场流动性的主要阻力。这是由于监管压力(SEC 指控 BUSD 为证券)、资本轮换(选择美国国债而不是无息稳定币)以及投资者对熊市的兴趣减弱等综合因素造成的。
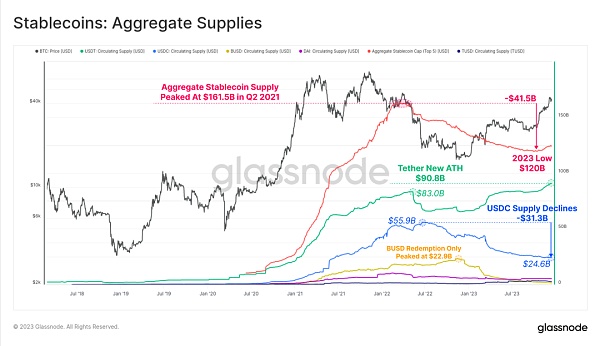
图28:稳定币:总供给
然而,10 月是一个关键点,稳定币总供应量触底于 $1,200亿,供应量开始以每月高达 3% 的速度增长。这是自 2022 年 3 月以来稳定币供应量的首次扩张,也可能是投资者兴趣回归的迹象。
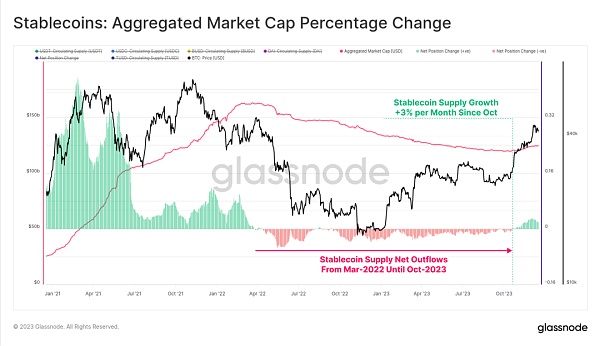
图29:稳定币:总市值百分比变化
各种稳定币之间的相对主导地位在2022年至2023年间也发生了显著变化。此前上涨的稳定币如USDC和BUSD的主导地位已大幅萎缩,BUSD进入仅限赎回模式,而USDC的主导地位自2022年6月以来从37.8%下降至19.6% 。
Tether(USDT)再次成为最大的稳定币,总供应量攀升至超过 906 亿美元,占据 72.7% 的市场份额。
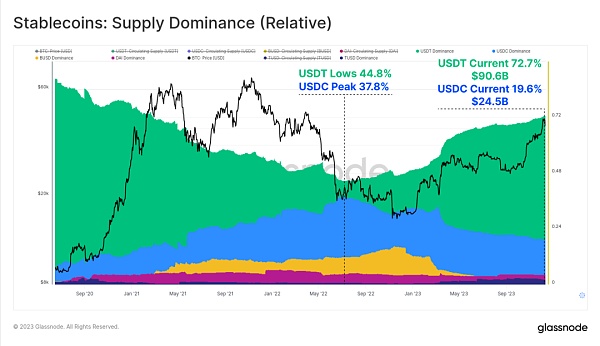
图30:稳定币:供应占比(相对)
最后,我们可以将 BTC 和 ETH 的已实现市值 30 天的变化与稳定币进行比较。这三个指标有助于可视化和衡量相对资本流动以及行业之间的轮换。
10 月份再次成为关键时刻,三大资产的资本流入均转为正数。由此可见,市场突破 3 万美元的关键水平、机构对衍生品市场的兴趣扩大以及三大主要数字资产的净资本流入保持一致。
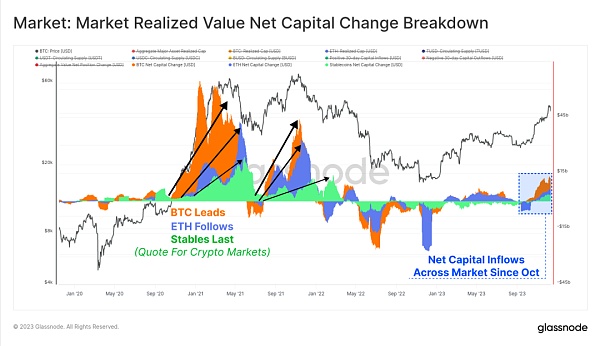
图31:市场:市场已实现价值净资本
总结
2023 年与 2022 年毁灭性的去杠杆化和市场下跌趋势截然不同。相反,今年人们对数字资产重新产生了兴趣,这归因于数字资产的出色表现,以及比特币铭文这一种新型资产的出现。
比特币供应目前由长期持有者紧紧持有,大多数投资者持有的比特币都处于盈利状态。随着 美国推出比特币 ETF 的可能性越来越大,以及即将到来的4月份比特币减半,2024注定是不平凡的一年。
Unconsciously, the year is coming to an end. In this paper, we will systematically summarize and browse the changes that have taken place in this year's chain, and discuss how the pattern of Bitcoin Ethereum derivatives and stable coins has evolved in and how they have laid an exciting road for the future. It is an unforgettable year for the encryption industry that Bitcoin has risen more than and the correction is not much, and several important technologies and chain pricing models of stable coins have broken through the history in the encryption market in. The new record month is the key node of institutional capital flow. At present, the supply of bitcoin held by long-term holders has almost reached the highest level in history. Most bitcoins are now in a profitable state, and the market structure is undergoing major changes. For example, the dominant position of stable currency has been re-established, and futures have surpassed the currency security for the first time, and the remarkable growth of the options market has made the encryption industry an unforgettable year, in which bitcoin has risen more than other digital assets, and the market value of Ethereum and most counterfeit coins has also increased quite strongly. From the above, we can see that the dominant position of Bitcoin is rising, which is usually regarded as a sign that the market has recovered from a long-term bear market, such as the middle of the year, especially Ethereum. Despite the successful release of the upgrade in Shanghai and the development of the ecosystem, compared with Bitcoin, Ethereum started a little slowly, and the rate fell to a multi-year low of around. Although the performance of digital assets is obviously better than traditional assets such as stocks, bonds and precious metals throughout the year, most of the increase comes from the rebound after the end of the month, and Bitcoin broke through first. The psychologically important price level of US$ 10,000 and many important price barriers show that the market value performance correction range is not obvious year-to-date. Another unique performance in 2008 is that all the price corrections of Bitcoin are very shallow. Historically, Bitcoin usually pulls back from a local high point during the bear market recovery and bull market upward trend, at least even in many periods, the deepest callback closing price is lower than the local high point, indicating that there is a buyer's support chart at this point. Bitcoin bull market corrects the adjustment depth of Ethereum. The relatively shallow and deepest adjustment was achieved in early January. Although the performance was weak compared with Bitcoin, it also described a constructive background, that is, the supply of Ethereum was reduced to meet the relatively flexible demand. The cruelty of the bear market in Ethereum bull market was slightly lower than that in the bear market cycle in 2008. Most mainstream digital assets have declined since 2008, but the recent strong performance has made up for most of the losses. Compared with its decline, the current mainstream digital assets do not include and stabilize the counterfeit currency. Fixed-currency supply chart Bitcoin and Ethereum decline from the chain point of view, the realized market value of sum can track their respective capital flows. The total realized market value decline during the bear market in reached a level similar to that in the previous cycle. However, the recovery speed of capital inflow this year is much slower. It has been days since Bitcoin realized its market value. In contrast, it takes about days to fully recover the realized market value of Bitcoin and Ethereum in the historical cycle. The falling of the moon is a major turning point in 2008, when the bitcoin market broke through many technologies and online pricing models. All these performances are helpful for us to understand its strong momentum. The short-selling in January pushed bitcoin above the realized price orange, which has been preventing the price from rising since June. This rise also broke through the blue until March, when the red met resistance, the monthly bitcoin price continued to consolidate between blue and the real market average price green, and entered the period of minimum fluctuation in bitcoin history. One, soon after, the price of Bitcoin fell from US dollars to US dollars in one day and was lower than the average of the above two long-term technical price indicators. The rebound in January really changed the market state, and the price began to rise and broke through the key psychological level of US$ 10,000. Since then, Bitcoin has reached the annual high of US$ 10,000. In this paper, we repeatedly mentioned a key node, and the market activity and price performance of capital flow have accelerated since the end of the month. With the price of Bitcoin exceeding US$ 10,000, Key psychological level We can think that the current market is a transition from an uncertain recovery stage to an enthusiastic upward trend. It is worth noting that the rebound in January broke through two important technical indicators, which described this transformation in the previous cycle. The macro price level of the midpoint of the technical market as the support level in the early stage of the bear market and the resistance level in the late stage of the bear market, after the dollar fell below the last main support area in this bear market, a series of capitulation selling appeared. Finally, the average price of the real market reflects the basic cost of active investors. Compared with the midpoint of the cycle, we can also clearly see the recovery of the bitcoin bear market signal, because all eight indicators have entered the positive region since January, as shown in the following figure. For most of the year, the data of each indicator is uneven, showing very similar characteristics to the year period. Eight indicators have now entered the positive value, which shows that the bitcoin market has entered a positive region related to the elastic upward trend. The signal from the bitcoin bear. We can see that the transaction volume of Bitcoin was relatively stagnant months ago, and the increase in the month prompted the transaction volume of Bitcoin to double from $100 million a day to over $100 million a day, which is the highest level since January. This once again proves to us that the month is a phased change in the market to some extent. The total transaction volume of Bitcoin is adjusted by the entity, and the inflow and outflow of Bitcoin and Ethereum trading platforms have increased, indicating the market. Interest in spot trading has increased. It is worth noting that the growth rate of bitcoin trading volume is obviously faster than that of Ethereum, which is consistent with the observation that bitcoin's dominant position is rising. After a long bear market, we often see that bitcoin leads investors' confidence out of the doldrums. The following chart helps to visually show this phenomenon. The number of bitcoin transactions in the inflow and outflow years of bitcoin and Ethereum trading platforms has reached a record high, mainly due to the emergence of ordinal numbers and inscriptions. These transactions embed data such as text files and images into the signature part of the transaction, so we can now evaluate two types of bitcoin transactions. The total transaction count of orange is unfiltered, and the transaction volume of blue bitcoin has reached a new high for many years, almost reaching the highest point in history. On the basis of bitcoin transactions, the transaction volume of bitcoin inscriptions is added to a transaction chart every day. Most of the inscriptions are often text-based and related to the blue standard of new assets. At the peak, the number of inscriptions traded on the bitcoin chain exceeds 10,000 per day, far exceeding the monthly image-based inscription of orange. 比特币今日价格行情网_okx交易所app_永续合约_比特币怎么买卖交易_虚拟币交易所平台
注册有任何问题请添加 微信:MVIP619 拉你进入群

打开微信扫一扫
添加客服
进入交流群
1.本站遵循行业规范,任何转载的稿件都会明确标注作者和来源;2.本站的原创文章,请转载时务必注明文章作者和来源,不尊重原创的行为我们将追究责任;3.作者投稿可能会经我们编辑修改或补充。