
Coinbase & Glassnode:2024 Q1 加密市场投资指南


原文来源:CoinbaseGlassnode 原文编译:Yanan,比推 BitpushNews
该指南是 Coinbase Institutional 和 Glassnode 联手打造的调研报告,为机构投资者深入剖析了最关键的加密市场指标与趋势。
市场概况
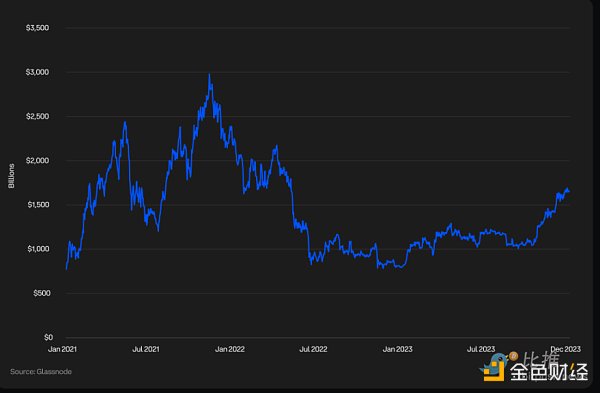
加密货币总市值
加密货币总市值是反映全球数字资产市场价值的重要指标,涵盖了比特币(BTC)、以太坊(ETH)、代币和稳定币等。2023 年,在比特币和以太坊的强劲表现带动下,加密货币总市值增长超过了 108% 。
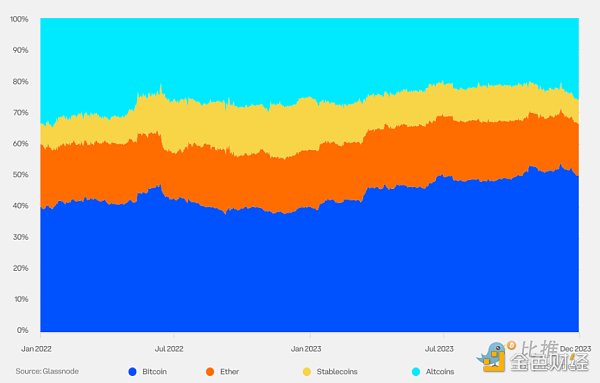
加密货币主导地位
加密货币主导地位衡量的是特定加密货币的市值占所有加密货币总市值的百分比。2023 年,随着市场对比特币现货 ETF 批准前景日益看涨,以及资金向优质资产转移,比特币的主导地位有所上升。一些市场参与者还将 2024 年 4 月的比特币减半视为潜在的价格上涨催化剂。
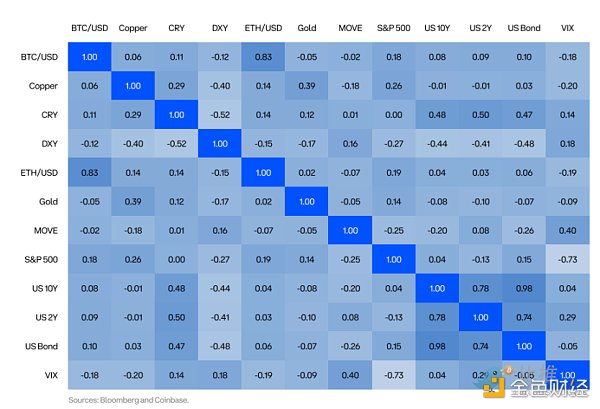
相关性
从历史上看,加密货币与传统资产类别的相关性较低。2022 年是一个例外,当时几乎所有资产都同步下跌,但 2023 年市场又回归历史常态,这表明加密货币会成为非系统性风险来源之一。
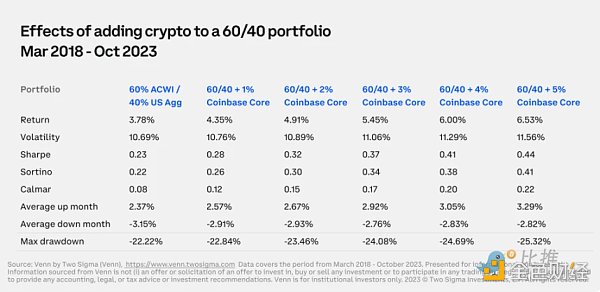
投资组合多元化
配置加密货币有助于传统投资组合分散风险并提升收益。在本表中,我们分析了在 60% MSCI ACWI(译者注:MSCI ACWI 是摩根斯坦利资本国际公司(MSCI)推出的一款全球股票指数,全称为 MSCI All Country World Index。)和 40% 美国 Agg ( 译者注:指的是美国债券市场的一个广泛指数,全称为「Bloomberg Barclays US Aggregate Bond Index」。) 构成的投资组合中,少量配置 Coinbase 核心指数(COINCORE)的效果。COINCORE 是一个基于市值加权的加密货币指数,每季度重新平衡,其中比特币和以太坊的权重分别占 65.3% 和 28.7% ,两者合计近 94% 。设定期间为 2018 年 3 月至 2023 年 10 月,覆盖了加密货币市场的两个主要波动周期。结果显示,加入 COINCORE 后,投资组合的绝对回报和风险调整后回报均得到提升。
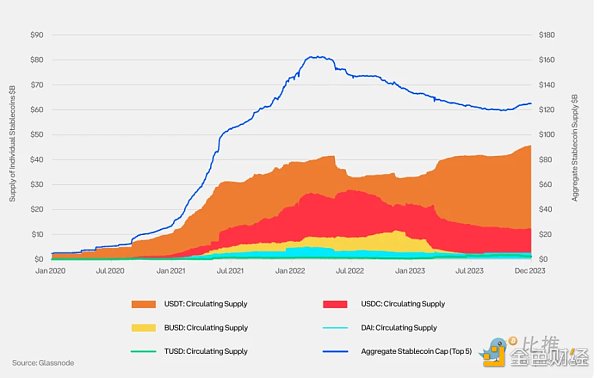
稳定币流通供应量
稳定币是一种旨在维持稳定价值的数字货币。它们通常以 1: 1 的固定汇率与美元或其他法定货币挂钩,并持有相应储备资产。由法定货币支持的稳定币占据了稳定币市场的主导地位。市场参与者在评估稳定币时,应重点考察其储备资产的数量和类型。
比特币
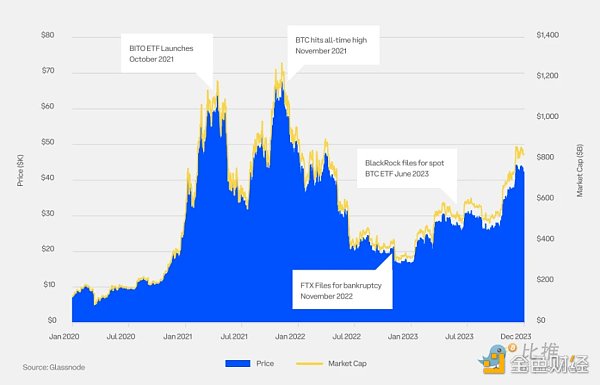
BTC 价格与市值
2023 年,比特币价格涨幅超过 155% 。市场参与者受到多方面因素的鼓舞,包括通胀步伐的放缓以及现货加密货币交易所交易基金(ETFs)获批可能性的增加。
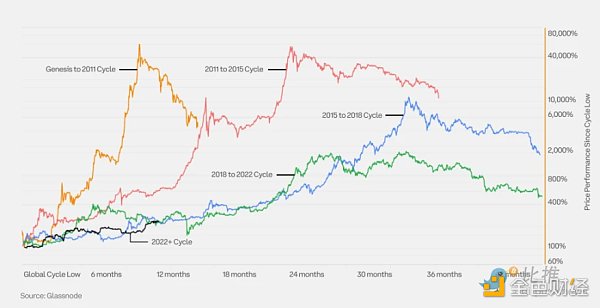
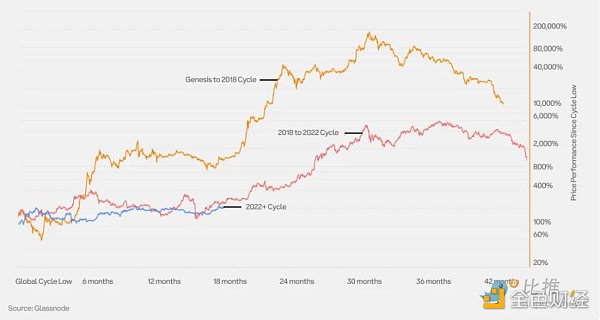
自周期低点以来的 BTC 价格表现
比特币已经历了四个完整的牛熊周期。在本图表中,我们可以观察到始于 2022 年的当前市场周期与之前周期的对比情况。
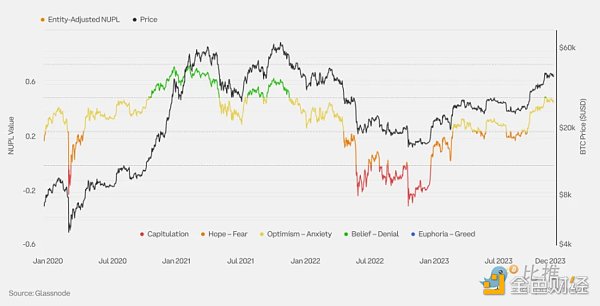
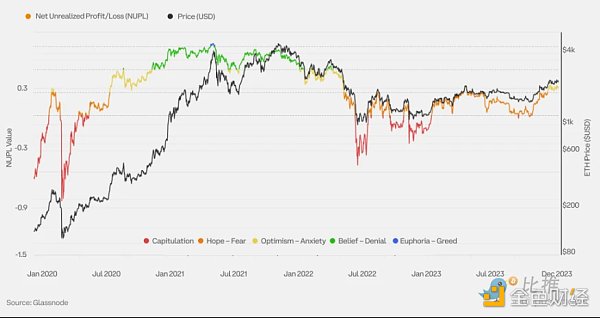
比特币实体持有调整后的净未实现盈亏(NUPL)
净未实现盈亏(NUPL)是指相对未实现利润与相对未实现亏损之间的差额。经过调整的 NUPL 排除了同一实体地址之间的交易(「内部」交易),以更准确地衡量实际经济活动,并提供比未调整 NUPL 更为优化的市场信号。
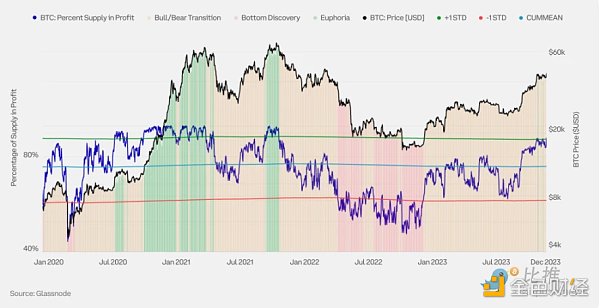
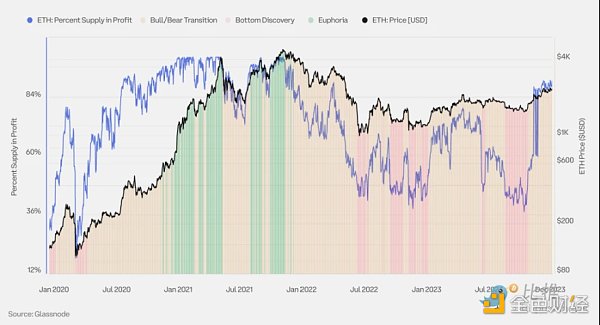
BTC 供应盈利能力
加密货币的流通供应量由亏损供应量(成本基础高于当前现货价格的所有币种)和盈利供应量(成本基础低于当前现货价格的所有币种)组成。观察供应盈利能力有助于揭示加密货币价格在当前市场周期中的位置。之前的加密货币市场周期具有三个阶段的特征:
底部发现期:在熊市的最后阶段,当长期的价格贬值导致亏损供应量的比例上升时(盈利供应量百分比< 55% )。
狂热期:在牛市期间,当价格呈现抛物线式上涨趋势时,盈利供应量的比例占据主导地位(盈利供应量百分比> 95% )。
牛熊过渡期:介于底部发现期和狂热期之间的过渡时期,此时供应盈利能力更接近均衡状态(盈利供应量百分比在 55% 至 95% 之间)。
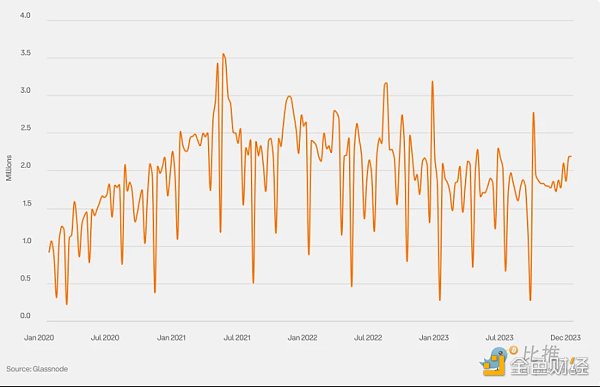
BTC 每日活跃地址数
活跃地址数指的是网络中作为发送或接收方而保持活跃的唯一地址数目,这一指标对于衡量用户接受度、网络状况及经济活动等方面至关重要。
BTC 每日活跃实体数
尽管活跃地址数是一个重要指标,但单个实体可以拥有多个地址,因此我们还需要关注活跃实体的数量。实体被定义为一组由同一网络实体控制的地址集群,这些地址集群是通过高级启发式和 Glassnode 专有的聚类算法进行估算的。 在这里,「高级启发式」指的是一种基于经验、知识和观察模式的复杂方法或技术,用于在信息不完整的情况下进行估计或决策。
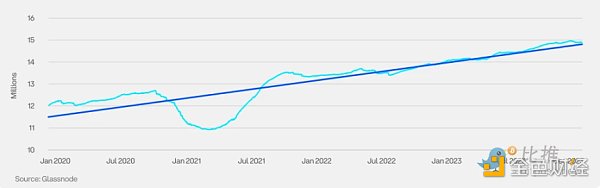
BTC 长期持有者持有的总供应量
Glassnode 将长期持有者(LTHs)定义为持有加密货币至少 155 天的投资者。这一持有期通常意味着这些资产被出售的可能性大为降低。因此,观察长期持有者的活动模式可作为预测加密货币市场周期性波动的有效指标,帮助识别潜在的顶峰和低谷。
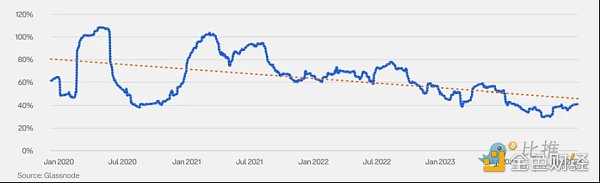
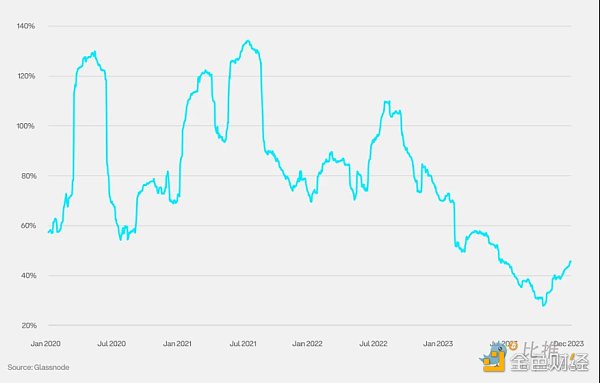
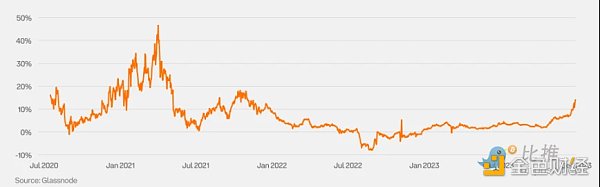
BTC 年化 3 个月波动率
随着加密货币作为资产类别的成熟以及机构参与度的提高,其波动率呈现稳步下降的趋势。
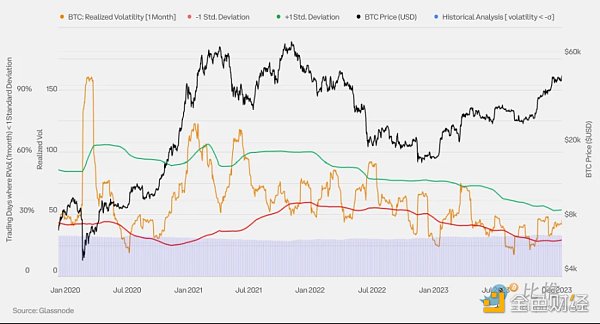
BTC 月度已实现波动率带
此图表运用布林带分析一个月的已实现波动率,以辨识潜在的波动转折点。若波动率偏离一个月均值一个标准差以上,则反转可能性较大。
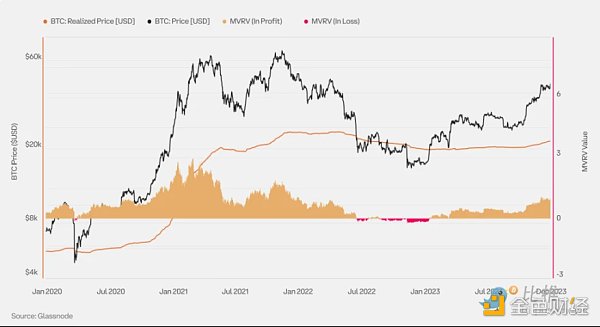
BTC 已实现价格和 MVRV
已实现价格是指加密货币供应的平均价格,按每个币种最后一次在链上交易当天的价值计算;它通常被视为市场的链上成本基础。MVRV 是市场价值与已实现价值的缩写;它表示市场价值(现货价格)与已实现价值(已实现价格)之间的比率。MVRV 为 2.0 意味着当前价格是市场平均成本基础的两倍(平均持有者盈利两倍)。
MVRV 为 1.0 意味着当前价格等于市场的平均成本基础(平均持有者处于盈亏平衡点)。
MVRV 为 0.50 意味着当前价格比市场平均成本基础低 50% (平均持有者亏损 50% )。
极端的 MVRV 值能揭示市场过热或低估的时段,以及投资者盈利远超或远低于平均水平(即已实现价格)的时期。
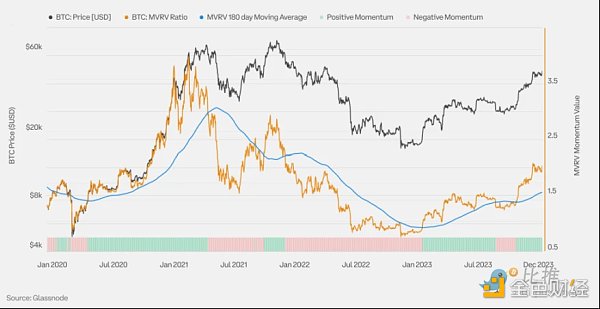
BTC MVRV 动量
此图表展示了 MVRV 比率以及用作动量指标的六个月简单移动平均线(SMA)。MVRV 高于六个月 SMA 的时期通常描述宏观市场的上升趋势,而低于该线的时期则通常描述下降趋势。
周期转折点通常表现为 MVRV 强烈突破六个月 SMA。强烈突破 SMA 上方表明有大量 BTC 以低于当前价格的水平获得,而强烈突破下方则表明有大量 BTC 以高于当前价格的水平获得。
BTC 衍生品
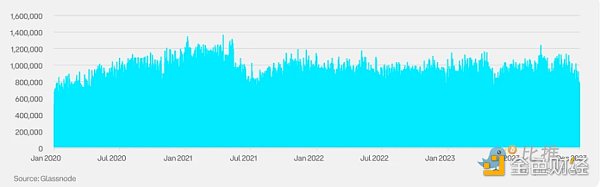
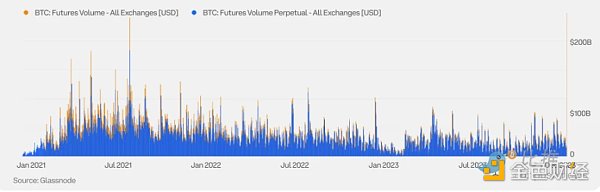
BTC 期货交易量
加密期货的交易量分为传统期货(也称为定期或日历期货)和永续期货(perps),后者是加密货币独有的。永续期货没有到期日,因此持有者无需进行展期操作。
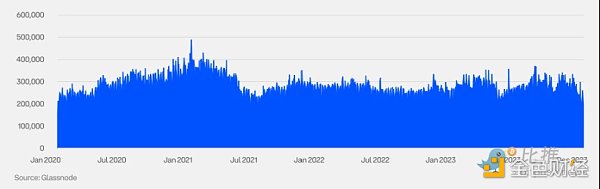
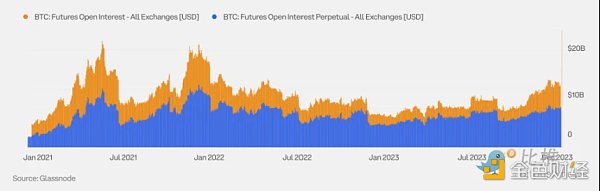
BTC 期货未平仓合约
虽然永续期货是 BTC 期货交易的主力,但传统期货因对冲和现货套利交易的广泛应用,仍在 BTC 期货未平仓合约中占有重要地位。
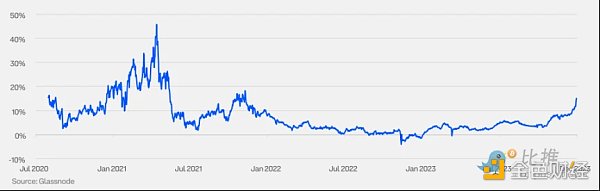
BTC 期货年化滚动基差(3 M)
加密货币市场中的基差历来为正(市场脱节除外)。基差的极端波动,无论是正向还是负向,往往与市场情绪的大幅波动有关。
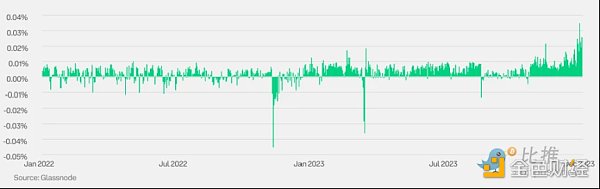
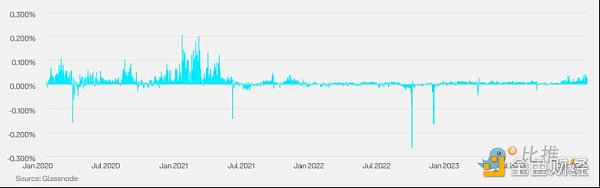
BTC 永续期货资金费率
永续期货没有设定到期日,故持有者无需进行展期操作。为维持价格与现货价格的合理差距,永续期货引入了资金费率机制。这一费率定期在多方和空方之间转移:当资金费率为正时,多头支付给空头;当资金费率为负时,空头支付给多头。
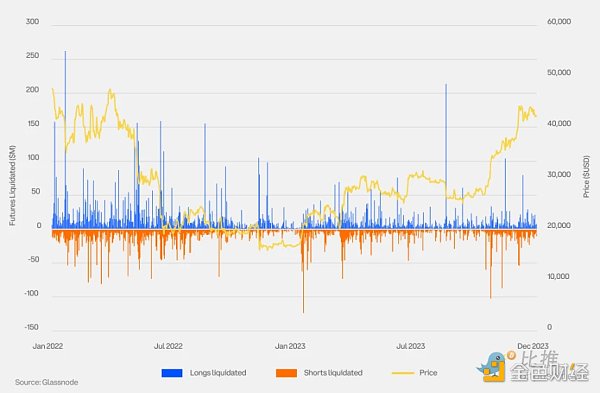
BTC 永续期货清算
清算是指交易所因期货头寸的初始保证金部分或全部损失而强制平仓。大规模的清算可能预示着价格急剧波动的顶部或底部。
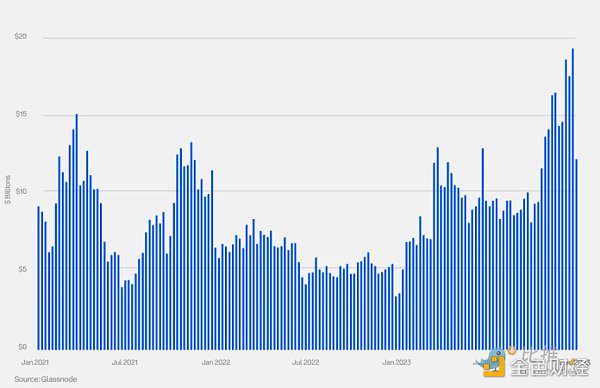
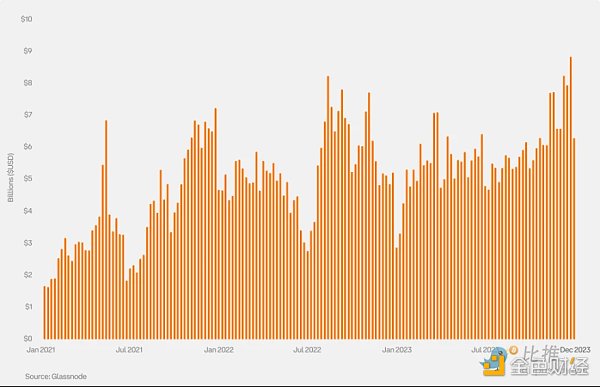
BTC 期权未平仓合约
随着机构投资者越来越多地进入这一领域, 2023 年期权未平仓合约有所增加。2023 年 10 月,BTC 期权的未平仓合约首次超过 BTC 期货。
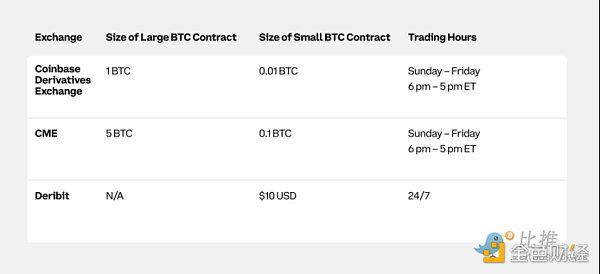
BTC 传统期货规格
比特币期货由多家交易所提供,具有不同的规模和面额。
BTC 接下来要面对的市场事件:比特币减半
我们预测, 2024 年二季度即将到来的比特币减半可能会提振代币表现。尽管如此,这种关联仍带有投机性,因为支持证据有限。历史上只发生过三次减半,尚未形成完全明确的模式,尤其考虑到先前事件受到全球流动性措施等多种因素的影响。
以太坊
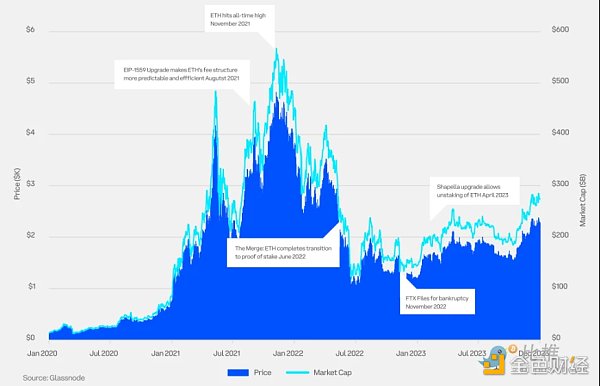
以太坊(ETH)价格与市值
2023 年,以太坊(ETH)价格上涨超 90% ,这得益于 Shapella 升级的成功以及加密货币现货交易型开放式指数基金(ETF)获批前景的日益明朗,市场参与者备受鼓舞。
自周期低点以来的价格表现
以太坊已经历了两个完整的牛熊周期。在本图表中,我们可以观察到始于 2022 年的当前市场周期与之前周期的对比情况。
以太坊未实现净盈亏(NUPL)
未实现净盈亏是指相对未实现利润与相对未实现亏损之间的差额。
以太坊(ETH)的供应量盈利状态
加密货币的流通供应量由亏损供应量(成本基础高于当前现货价格的所有币种)和盈利供应量(成本基础低于当前现货价格的所有币种)组成。观察供应盈利能力有助于揭示加密货币价格在当前市场周期中的位置。之前的加密货币市场周期具有三个阶段的特征:
底部发现阶段:在熊市的最后阶段,当价格长期贬值导致亏损供应量的比例上升时(盈利供应量百分比 < 55% ),市场进入底部发现阶段。
狂热阶段:当牛市期间出现抛物线式的价格上升趋势时,盈利供应量的比例占主导地位(盈利供应量百分比 > 95% ),市场进入狂热阶段。
牛熊过渡阶段:这是底部发现阶段和狂热阶段之间的过渡时期,此时供应量的盈利状态更接近均衡(盈利供应量百分比介于 55% 和 95% 之间)。
以太坊(ETH)周活跃地址数
活跃地址数是指在网络中作为发送方或接收方参与活动的唯一地址数量。它是衡量用户采用率、网络健康状况、经济活动等的重要指标。
以太坊年化 3 个月波动率
随着加密货币作为一种资产类别的成熟和机构参与的增加,波动率呈稳步下降趋势。
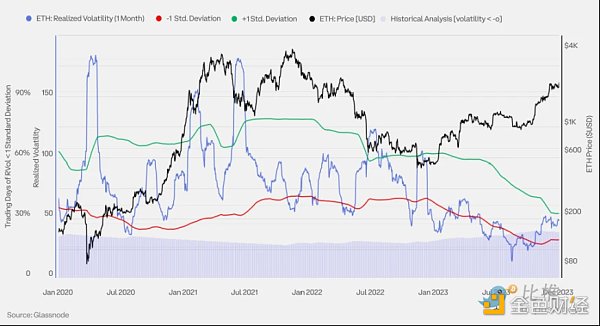
以太坊月度已实现波动率带
此图表运用布林带分析一个月的已实现波动率,以辨识潜在的波动转折点。若波动率偏离一个月均值一个标准差以上,则反转可能性较大。
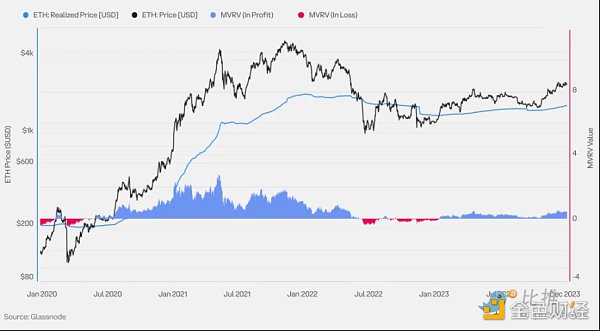
以太坊(ETH)已实现价格与 MVRV
已实现价格是指加密货币供应的平均价格,按每个币种最后一次在链上交易当天的价值计算;它通常被视为市场的链上成本基础。MVRV 是市值与已实现价值比值的缩写,它表示市值(现货价格)与已实现价值(已实现价格)之间的比率。
MVRV 为 2.0 意味着当前价格是市场平均成本基础的两倍(平均持有者盈利两倍)。
MVRV 为 1.0 意味着当前价格等于市场的平均成本基础(平均持有者处于盈亏平衡点)。
MVRV 为 0.50 意味着当前价格低于市场平均成本基础的 50% (平均持有者亏损 50% )。
极端的 MVRV 值有助于识别市场过热或低估的时期,以及投资者盈利能力大幅偏离平均值(已实现价格)的时期。
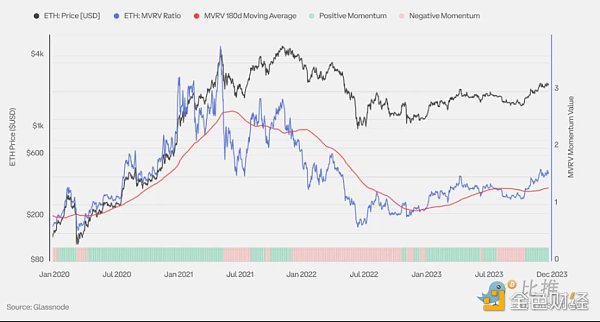
以太坊(ETH)MVRV 动量
此图表展示了 MVRV 比值以及用作动量指标的六个月简单移动平均线(SMA)。MVRV 高于六个月 SMA 的时期通常描述宏观市场的上升趋势,而低于的时期则通常描述下降趋势。
周期转折点通常以 MVRV 强烈突破六个月 SMA 为特征。强烈突破 SMA 上方表明有大量 ETH 是在当前价格以下购入的,而强烈突破下方则表明有大量 ETH 是在当前价格以上购入的。
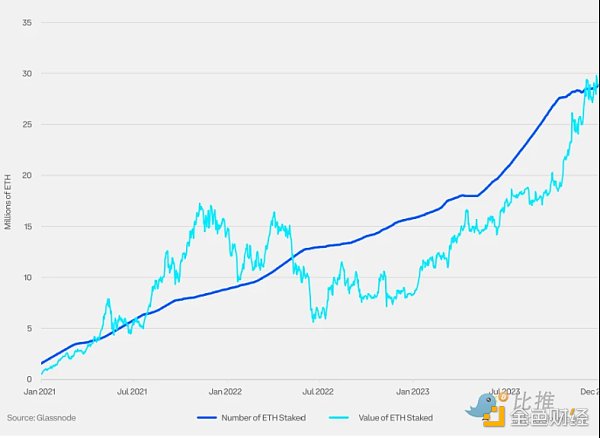
以太坊(ETH)总质押价值
质押是权益证明(PoS)区块链的一种投资方式,代币持有者通过抵押资产来保障网络安全,并获得额外代币作为奖励。为了进行 ETH 质押,持有者需抵押至少 32 个 ETH 并运行验证者节点。
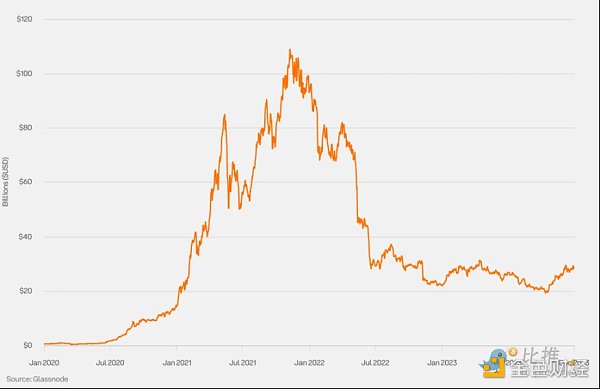
以太坊(ETH)在 DeFi 中的总锁仓价值
总锁仓价值(TVL)是以太坊区块链上智能合约锁定或去中心化应用中存入的资产总值,涵盖 ETH、稳定币和各类代币。它是评估以太坊生态内金融活动和流动状况的重要指标。
以太坊(ETH)衍生品
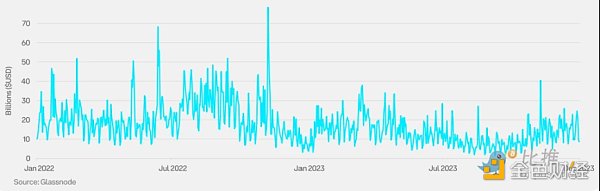
以太坊永续期货交易量
加密期货交易量分为传统期货(也称为定期或日历期货)和永续期货(perps),后者为加密货币所独有。永续期货没有到期日,因此持有者不需要进行展期操作。以太坊期货的交易量以永续期货为主。
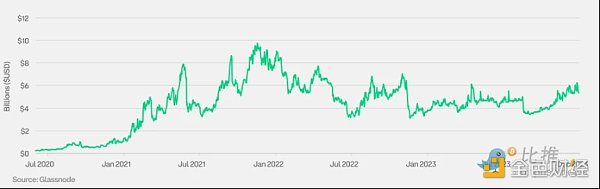
以太坊永续期货持仓量
以太坊期货的持仓主要集中于永续期货,而传统期货的交易量相对较少。
以太坊期货年化滚动基差(3 M)
加密市场的基差通常为正。其极端波动,无论正负,多与市场情绪的剧烈变动紧密相连。
以太坊永续期货资金费率
为维持价格与现货价格的合理差距,永续期货引入了资金费率机制。这一费率定期在多方和空方之间转移:当资金费率为正时,多头支付给空头;当资金费率为负时,空头支付给多头。
以太坊(ETH)期权持仓量(每周)
随着市场参与者对现货 ETF 的前景和 2024 年以太坊的发展日益看涨,以太坊期权的持仓量在 2023 年第四季度创下历史新高。
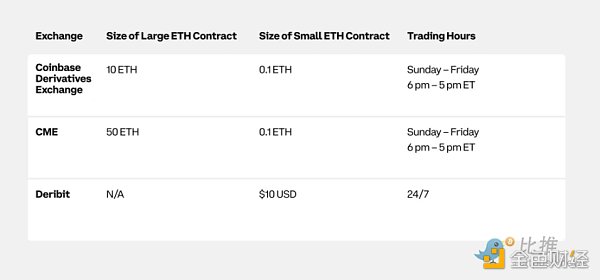
以太坊(ETH)传统期货规格
以太坊期货由多家交易所提供,具有不同的规模和面额。
以太坊(ETH)接下来要面对的市场事件
在 Shapella 升级圆满完成后,以太坊社区正翘首以盼 Cancun(「Decun」)升级的到来,该升级预计于 2024 年第一季度实施。Cancun 升级将主要通过引入 Proto-Danksharding 来强化以太坊网络的可扩展性和安全性。Proto-Danksharding 的设计目标是大幅降低第二层交易的费用,并显著提升以太坊网络每秒的交易处理能力。
The guide is a research report jointly created with the company, which deeply analyzes the most critical market indicators and trends for institutional investors. The total market value of cryptocurrency is an important indicator reflecting the market value of global digital assets, covering bitcoin, ethereum, tokens and stable coins. Driven by the strong performance of bitcoin and ethereum, the total market value of cryptocurrency has increased more than that of the first quarter of the cryptocurrency investment guide. Currency dominance measures the market value of a specific cryptocurrency as a percentage of the total market value of all cryptocurrencies. In, with the market's increasingly bullish prospects for spot approval of Bitcoin and the transfer of funds to high-quality assets, the dominance of Bitcoin has increased. Some market participants also regarded the bitcoin in June as a potential price increase catalyst. Historically, the correlation between cryptocurrencies and traditional asset classes was low, and the year was an exception. Assets all fell synchronously, but the market returned to the historical normal in, which indicates that cryptocurrency will become one of the sources of unsystematic risks. In the first quarter, the diversified allocation of cryptocurrency will help traditional portfolios spread risks and improve returns. In this table, we analyze a global stock index launched by Morgan Stanley Capital International and a broad index of the US bond market. The effect of allocating a small amount of core index is that a cryptocurrency index based on market value weighting is rebalanced every quarter, in which the weights of Bitcoin and Ethereum are respectively and together. The near-set period is from year to month, covering two major fluctuation cycles of cryptocurrency market. The results show that the absolute return and risk-adjusted return of the portfolio have been improved after joining. The investment guide of cryptocurrency market in the first quarter is to stabilize the currency circulation supply and stabilize the currency, which is a digital currency aimed at maintaining a stable value. They are usually linked to the US dollar or other legal tender at a fixed exchange rate, and hold corresponding reserve assets. The stable currency backed by legal tender occupies the dominant position in the stable currency market. Market participants should focus on the quantity and type of their reserve assets when evaluating the stable currency. Investment guide for the encrypted market in the first quarter Bitcoin price and market value The annual increase of Bitcoin price exceeds that of market participants, who are encouraged by many factors, including the slowdown of inflation and the exchange-traded funds of spot cryptocurrencies. The possibility of approval increases. The price performance of the encrypted market investment guide in the first quarter since the low point of the cycle. Bitcoin has gone through four complete bull-bear cycles. In this chart, we can observe the comparison between the current market cycle starting in and the previous cycle. In the first quarter, the encrypted market investment guide, Bitcoin entities hold the adjusted net unrealized profit and loss. Net unrealized profit and loss refers to the difference between the relative unrealized profit and the relative unrealized loss, which is adjusted to exclude the same entity address. In order to measure the actual economic activities more accurately and provide more optimized market signals than unadjusted, the investment guide of cryptocurrency market in the first quarter provides profitability. The circulation supply of cryptocurrency consists of all currencies with loss supply cost basis higher than the current spot price and all currencies with profit supply cost basis lower than the current spot price. Observing the profitability of supply helps to reveal the position of cryptocurrency price in the current market cycle. The period has the characteristics of three stages: the bottom discovery period is in the last stage of the bear market, when the long-term price depreciation leads to the increase of the proportion of loss supply, the percentage of profit supply is dominant during the bull market, when the price shows a parabolic upward trend, the percentage of profit supply is dominant, and the transitional period between the bottom discovery period and the fanatical period is between the bull and bear. At this time, the supply profitability is closer to equilibrium, and the percentage of profit supply is encrypted in the first quarter between and. Market investment guide Daily active address number Active address number refers to the number of unique addresses in the network that remain active as the sender or receiver. This indicator is very important for measuring user acceptance, network conditions and economic activities. The first quarter encrypted market investment guide Daily active entity number Although the number of active addresses is an important indicator, a single entity can have multiple addresses, so we also need to pay attention to the number of active entities. Entities are defined as a group controlled by the same network entity. These address clusters are estimated by advanced heuristics and proprietary clustering algorithms. Here, advanced heuristics refer to a complex method or technology based on empirical knowledge and observation patterns, which is used to estimate or make decisions under the condition of incomplete information. The total supply held by long-term holders in the first quarter is defined as investors who have held cryptocurrency for at least days. This holding period usually means that these assets are highly likely to be sold. Therefore, observing the activity pattern of long-term holders can be used as an effective indicator to predict the periodic fluctuation of cryptocurrency market, helping to identify potential peaks and valleys. The annualized monthly volatility of cryptocurrency investment guide in the first quarter shows a steady downward trend with the maturity of cryptocurrency as an asset class and the increase of institutional participation. The monthly realized volatility of cryptocurrency investment guide in the first quarter is used to analyze the realized volatility of one month to identify potential. At the turning point of fluctuation, if the volatility deviates from the monthly average by more than one standard deviation, it is more likely to reverse. In the first quarter, the realized price and the realized price refer to the average price of cryptocurrency supply, which is calculated according to the value of each currency on the last trading day in the chain. It is usually regarded as the chain cost basis of the market, which is the abbreviation of market value and realized value. It indicates the market value, and the ratio between spot price and realized value means the current price. It is twice the average cost basis of the market and twice the average holder's profit, which means that the current price is equal to the average cost basis of the market. The average holder is at the breakeven point, which means that the current price is lower than the average cost basis of the market. The extreme value of the average holder's loss can reveal the period when the market is overheated or underestimated and the period when the investor's profit is far above or far below the average level, that is, the realized price. This chart shows the ratio and the period when the six-month simple moving average used as a momentum indicator is above six months, which usually describes the upward trend of the macro market and below it. 比特币今日价格行情网_okx交易所app_永续合约_比特币怎么买卖交易_虚拟币交易所平台
注册有任何问题请添加 微信:MVIP619 拉你进入群

打开微信扫一扫
添加客服
进入交流群
1.本站遵循行业规范,任何转载的稿件都会明确标注作者和来源;2.本站的原创文章,请转载时务必注明文章作者和来源,不尊重原创的行为我们将追究责任;3.作者投稿可能会经我们编辑修改或补充。