LD Capital:从未实现净损益、长短期持有量变动以及BTC市值占比 分析BTC所处市场阶段
作者:LD capital,Duoduo
上周,BTC最高突破64000,已经非常接近上一轮牛市的高点69000了。同时,市场新发行资产的价格也不断被推高,泡沫正在形成和放大之中。对于过去两年建仓BTC的玩家来说,开始思考一个问题,BTC现在处于什么阶段?何时该止盈离场?
Glassnode提供了大量的BTC分析指标,从中选取未实现净损益(NUPL,Net Unrealized Profit/Loss)和长短期持有量变动(Long/Short-Term Holder Threshold)这两个指标,来看看市场所处的位置。
未实现净损益(NUPL,Net Unrealized Profit/Loss)
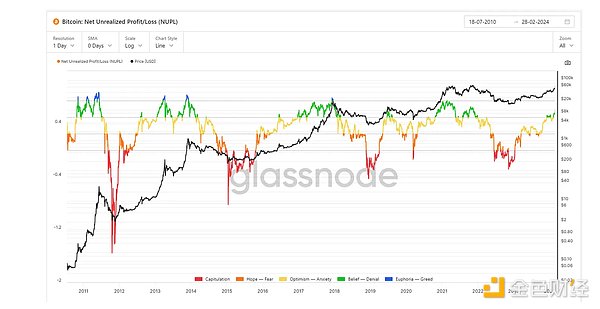
未实现净损益(NUPL)试图回答的问题是:在任何给定时间点,比特币的流通供应量中有多少是盈利或亏损的,以及盈利或亏损的程度如何?
NUPL通过计算当前市值与已实现市值之间的差异,来描述BTC整体盈利和亏损的状态。NUPL计算公式是:(Market Cap — Realised Cap) / Market Cap。已实现市值,是比特币前一次移动时的价格累计相加得到的数值。当前市值减去已经实现的市值,得到未实现市值。未实现市值为负数,则市场整体处于亏损状态;为正数,则表明市场整体盈利。未实现利润或者损失除以当前市值,就得到NUPL的具体数值。获利越小、损失越大,越接近底部;获利越大、损失越小,越接近顶部。
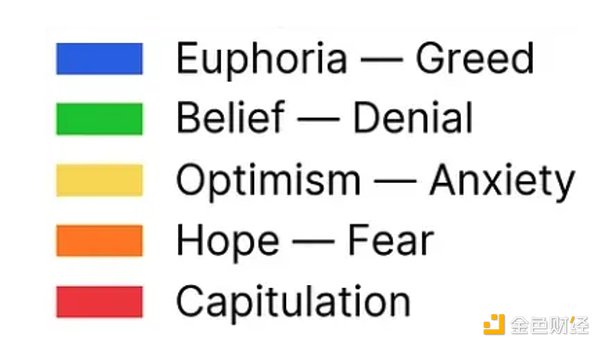
NUPL划分成了5个区域,红色区域位于0以下,属于亏损区域,此时也是买入的区间。橙色区域为0–0.25之间,属于微盈利区域。黄色区域为0.25–0.5。绿色区域为0.5–0.75。蓝色区域为0.75以上。通常,在0.25以下属于较好的买入区域,在0.5以上则可能进入牛市。
观察历史,可以看到:
1. NUPL很好地提示了底部区域。2022年的下半年基本处于0以下。对于顶部区间的提示,则相对较为宽泛。2017年的牛市触及蓝色区域的时间非常短暂,2021年则完全没有触及蓝色区域,整个牛市都在绿色区域运行。这增加了对顶部区域判断的难度。
就当前我们所处的位置,12月初至1月初处于绿色区域,之后下跌进入黄色区域将近1个月后,在2月7日再次进入绿色区域。目前属于本周期第二次进入绿色区域,持续将近1个月。
2. 2016年12月至2018年1月,为期14个月的时间内,NUPL基本上位于绿色区域中。该期间,BTC从780美元上涨至17000美元,涨幅约21倍。
2020年10月至2021年5月,以及2021年8月至2021年12月,为期11个月的时间内,NUPL也位于绿色区域中。2020年10月至2021年5月期间,BTC从13000美元上涨至63000美元,涨幅约4.8倍。
从持续的时间看,绿色区域持续的时间超过了10个月。
3. 需要注意的是,前两次牛市主升浪的开启,都是在减半之后。对照今年来看,BTC在减半之前已经接近新高,NUPL也在绿色区域运行超过了2个月。这一次无法简单按照减半行情刻舟求剑。
此前两轮牛市的减半行情,BTC减产的影响较大,造成供应量的大幅度减少,以及挖矿成本的提高,造成供不应求的局面,促进价格上涨。而本轮牛市,大部分BTC已经进入流通,减半对供应量的影响降低;此时,BTC ETF的通过,带来了大量的买盘,也造成了供不应求的局面,促成了行情的提前启动。BTC的行情将更多地受到美国货币政策、美股行情的影响。
长短期持有量变动(Long/Short-Term Holder Threshold)
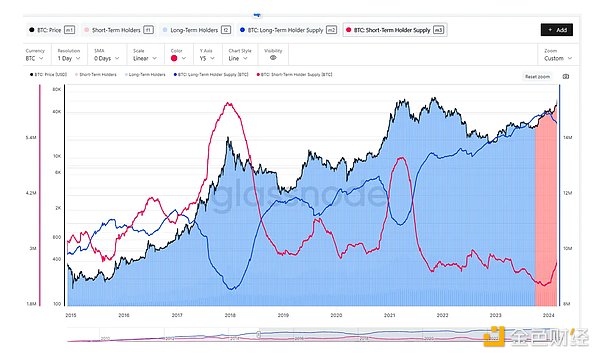
长期持有的BTC指的是存在同一地址中超过155天没有移动的BTC,短期持有的BTC则是指存在同一地址中155天内被移动的BTC。该指标的变化,可以看到长期持有者何时在积累代币,何时在卖出代币。
目前,长期持有的BTC总量约为1450万枚,短期持有的BTC总量约为287万枚,可见约83%的BTC处于长期持有的状态。
观察历史,可以看到:
1. 2017年1月初,BTC价格达到900美元,接近2013年底牛市高点(1000美元)时,长期持有的BTC开始减持卖出。卖出趋势一直持续到2018年初。与之对应的是,短期持有的BTC数量大量增加。
2. 2018年一整年,BTC处于下跌趋势中,长期持有的BTC又在处于增长趋势,投资者在该时间段内不断沉淀BTC。
3. 2019年4月,BTC突破5000美元之后,长期持有的BTC出现减持。至2019年8月,BTC下跌后,长期积累的数量又一路攀升持续至2020年。
4. 2020年10月,BTC突破11000美元之后,长期持有的BTC出现减持。减持趋势持续至2021年4月。
5. 在2021年度11月、2022年6月,长期持有的BTC有出现短暂的下跌,但之后都呈现持续增长的趋势。
6. 2023年12月初,长期持有的BTC开始出现减持。从最高峰的1498万枚下降至1450万枚,减少了大约50万枚。目前,这个趋势还在持续。
BTC市值占比(BTC.D)
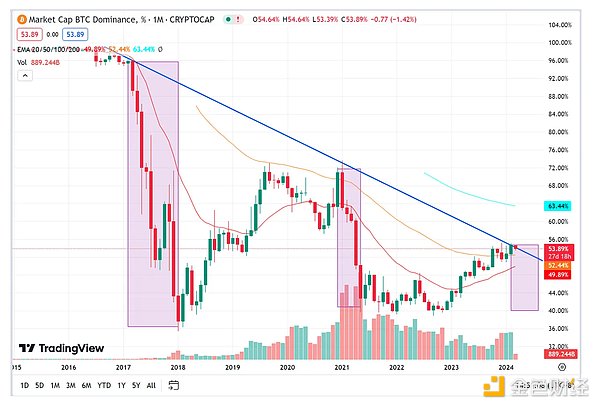
目前,BTC市值占加密货币总市值的53.87%。
观察历史数据,可以看到:
1. BTC市值在熊市增加,在牛市降低,2017年牛市、2021年牛市的低点都是在40%左右。
2. 每一轮熊市中,BTC市值占比在逐渐降低,形成了一个趋势线。当前的占比还在趋势线范围之内。本轮熊市以来,最高占比在54%左右。
3. 在牛市高点,BTC的市值占比应该下降至40%左右。目前,BTC的市值占比尚未出现明确的下降趋势。
结论
未实现净损益(NUPL)高于0.5,BTC持币地址获得超过50%以上的未实现利润。BTCNUPL高于0.5的区间,在2017年和2021年牛市中,持续时间分别为14个月和11个月,并且发生在减半之后。今年在减半之前已经进入普遍盈利区间2个月,行情与此前有所差异,受到美国货币政策和美股行情的影响可能更大。比如降息时点的确定,可能会带来行情的回调。
长短期持有量变动(Long/Short-Term Holder Threshold)来看,长期持有的BTC目前处于历史高位。不过,长期持有者从2023年12月开始逐步减持BTC。该行为与2017年、2020年类似。长期持有者在BTC突破前一轮牛市高点和本轮牛市高点之间,将持续处于卖出状态。
从BTC市值占比(BTC.D)来看,目前BTC市值占比仍处于较高水平,尚未出现明显下降趋势,山寨普涨主升浪行情尚未开启。
整体看,BTC处于主升浪行情的前期,山寨币主升浪行情尚未启动。
The author's highest breakthrough last week is very close to the high point of the last bull market. At the same time, the price of newly issued assets in the market is constantly being pushed up, and the bubble is being formed and enlarged. For players who have opened positions in the past two years, they have begun to think about a question at what stage and when to take profit and leave, providing a large number of analysis indicators, from which two indicators, unrealized net profit and loss and long-term and short-term holdings changes, are selected to see where the market is. It is how much of bitcoin's circulation supply is profitable or losing at any given time, and how to describe the overall profit and loss state by calculating the difference between the current market value and the realized market value. The calculation formula is that the realized market value is the value obtained by adding the prices of bitcoin in the previous move. The current market value MINUS the realized market value gets the unrealized market value. If the unrealized market value is negative, the overall market is in a loss state, and if it is positive, it indicates the market. The specific value obtained by dividing the unrealized profit or loss of the whole field by the current market value is that the smaller the profit is, the closer it is to the bottom, and the smaller the loss is, the closer it is to the top. The red area is located below and belongs to the loss area. At this time, it is also the buying area. The orange area is between the micro-profit areas, the yellow area is the green area, and the above is usually a better buying area. Above, it may enter the bull market to observe the history, which can be seen well. It shows that the bottom region in the second half of the year is basically in the following, and the tips for the top region are relatively broad. The bull market in the year touched the blue region for a very short time, but it didn't touch the blue region at all in the year, which increased the difficulty of judging the top region. At present, our position was in the green region from the beginning of the month to the beginning of the month, and then fell into the yellow region, and then entered the green region again on the day of the month. At present, it belongs to the second time in this cycle to enter the green region. It lasted for nearly a month, month to month, and it was basically in the green area. During this period, it rose from US dollar to US dollar by about times, and it was also in the green area during the period of months from month to month and from month to month, it rose from US dollar to US dollar by about times. From the perspective of duration, the green area lasted for more than months. It should be noted that the first two bull markets were all halved, and compared with this year, it was close before halving. The new high has also been running in the green area for more than a month. This time, it is impossible to simply carve a boat and seek a sword according to the halving market. The halving market in the previous two bull markets has had a great impact on the reduction of production, which has greatly reduced the supply and increased the mining cost, which has caused the situation of short supply and promoted the price increase. Most of the bull markets in this round have entered the circulation, which has reduced the impact on the supply. At this time, the adoption of halving market has also caused a situation of short supply, which has contributed to the early start of the market. Affected by the US monetary policy and the US stock market, long-term holdings change. Long-term holdings refer to those that have not moved for more than days in the same address, while short-term holdings refer to those that have been moved within days in the same address. We can see when long-term holders are accumulating tokens and when they are selling tokens. At present, the total amount of long-term holdings is about 10,000, and the total amount of short-term holdings is about 10,000. At the end of the year, when the bull market peaked at USD, the long-term holdings began to reduce their holdings and sell, and the selling trend continued until the beginning of the year. Correspondingly, the number of short-term holdings increased greatly, and the long-term holdings were in a downward trend throughout the year, and they were in a growing trend. After investors broke through USD in the period of time, the long-term holdings appeared to reduce their holdings and fell in the year, and the long-term accumulation continued to climb until the year broke through USD, and the trend of long-term holdings continued until the year. In the year, month, month and year, the long-term holdings showed a short-term decline, but then they all showed a trend of continuous growth. At the beginning of the year, the long-term holdings began to decrease from the highest peak of 10 thousand to 10 thousand, and the trend is still continuing. The historical data shows that the market value accounts for the total market value of cryptocurrency. It can be seen that the market value increases in the bear market and decreases in the bull market. The low point of the bull market in the bull market in the year is around, and the market value ratio is gradually decreasing in each round, forming a trend line. The current share is still within the trend line. The highest share since the current bear market is around, and the market value share at the high point of the bull market should drop to around. The current market value share has not yet shown a clear downward trend. Conclusion The unrealized net profit and loss is higher than the currency holding address, and the unrealized profit is higher than the interval, which lasts for months and months respectively in the bull market in and after halving, and this year has entered the general profit range before halving. The market has been different from before. The influence of US monetary policy and US stock market may be greater. For example, the determination of interest rate cuts may bring about a market correction. From the perspective of long-term and short-term holdings changes, the long-term holdings are at a historical high. However, the long-term holders have gradually reduced their holdings since January, which is similar to that of the long-term holders every year. They will continue to sell between breaking through the previous bull market high and the current bull market high. From the perspective of market value ratio, the current market value ratio is still at a relatively high level, and there has not been an obvious downward trend. As a whole, the main rising wave market of shanzhai coins has not yet started 比特币今日价格行情网_okx交易所app_永续合约_比特币怎么买卖交易_虚拟币交易所平台
注册有任何问题请添加 微信:MVIP619 拉你进入群

打开微信扫一扫
添加客服
进入交流群
1.本站遵循行业规范,任何转载的稿件都会明确标注作者和来源;2.本站的原创文章,请转载时务必注明文章作者和来源,不尊重原创的行为我们将追究责任;3.作者投稿可能会经我们编辑修改或补充。

