Galaxy:10 张图显示 RWA、DeFi 和以太坊生态系统充满活力


作者:Zack Pokorny;编译:白话区块链
摘要
截至2024年已经过去了50多天,我们看到链上资产证券化市值创历史新高,参与 DeFi 的地址数量在一些主要的 Layer 1 和 Layer 2 上创下了两年来的最高纪录,以太坊的 Layer 2 生态系统仍然保持着持续活跃。本报告通过链上数据的视角突显了围绕该行业展开的一些关键趋势。
主要观点
在2月2日,RWA Token市值总额达到了历史最高水平,约为27.74亿美元,而Token化金融资产市场(即国库券和债券、私人信贷和房地产)在2月8日也创下了新高,达到了16.14亿美元。尽管 RWA Token市值达到了这一里程碑,但在 DeFi 的关键领域,加密原生资产正在获得市场份额。
在主要的 Layer 1 和 Layer 2 上,与 DeFi 互动的地址数量接近两年来的最高水平,达到了44.5万个地址。去中心化交易平台是用户首次使用 DeFi 时最常见的 DeFi 应用之一。
在以太坊生态系统(Layer 1 和主要 Layer 2)中,每日活跃地址数量达到了历史最高水平,每日交易次数继续攀升。在过去一个月中,Layer 2 的收入也实现了实质性增长。
1、RWAs
2024年2月2日,Token化现实世界资产的市值达到了新的历史最高水平,为27.74亿美元。值得注意的是,包括国库券和其他债券、私人信贷以及房地产在内的金融资产,在2024年2月8日也创下了新的历史最高水平,达到了16.14亿美元。请注意,这些数值仅考虑了公共区块链上的 RWA Token本身的价值,如 Ondo 的 OUSG 和 Tether 的 XAUT,并不包括稳定币或发行者Token,如 ONDO 和 CFG。截至2024年2月26日,金融资产 RWA 的国债/债券占比为58.1%,较历史最高水平下降了约110个基点。
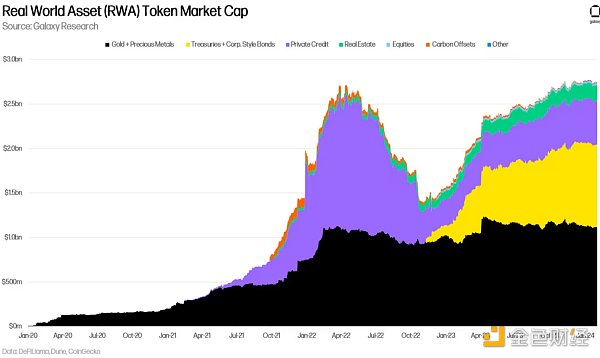
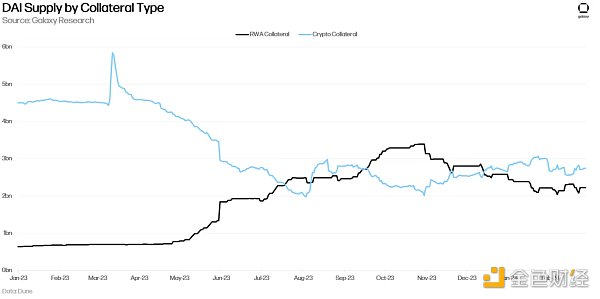
尽管 RWA Token的市值在链上创下了新高,但在链上产品中,RWA 的主导地位和使用情况却在逐渐减弱。这在 DAI 的抵押中最为明显,自2023年10月底以来,RWA 的使用一直在稳步下降。这是一个关键迹象,突显出人们更倾向于在链上使用加密原生资产,而非 RWA,从而也增加了对加密货币的需求。最近 LST 支持的稳定币的增长进一步加强了这一观点,并表明这一趋势是强劲的。
此外,加密原生资产的生产力在某些方面已经超过了 RWA。我们在12月1日的新闻简报中提到了这一点,以 Maker 和 DAI 为例,加密抵押贷款的稳定费率高于 RWA 的稳定费率。这种动态仍然存在,并且在 MakerDAO 投票决定提高其链上保险库中某些抵押品的稳定费率后,变得更为明显。
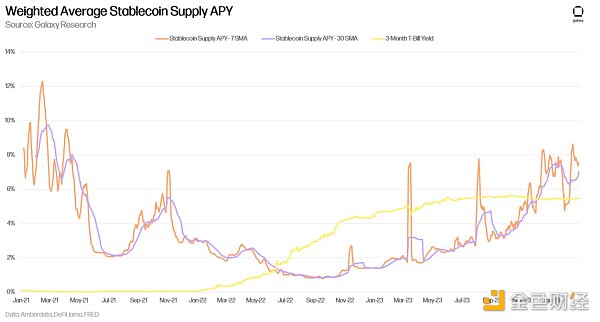
值得注意的是,它将通过其一个 stETH 保险库铸造 DAI 的费率提高了191个基点。这也反映在主要稳定币的供应 APY 相对于国债收益率上。下面的图表显示了跨越 Aave v2/v3 和 Compound v2/v3 的 USDT、USDC、DAI 和 FRAX 的借款数量加权平均供应 APY。自2023年10月底/11月初开始,稳定币的收益率一直超过了3个月期国库券的收益率,就在 DAI RWA 抵押品开始下降之前。
2、DeFi 用户和留存率
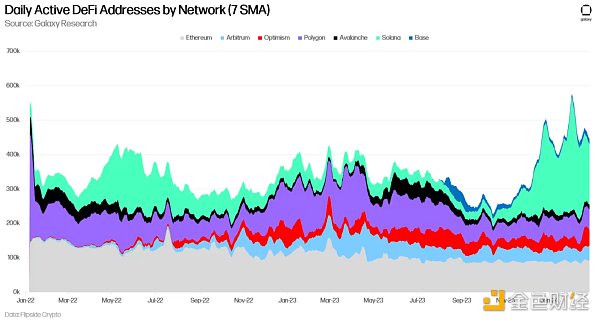
在主要的 Layer 1 和 Layer 2 上,使用 DeFi 的每日活跃地址(DAA)在7天简单移动平均线(SMA)上于2024年2月1日达到了576000 个地址,创下了新的两年高点。Solana 保持着最多的每日活跃 DeFi 地址,截至2024年2月20日,为196,000 个地址,此前在2024年2月1日(Jupiter 空投的次日)达到了330,000 个的高点。而与此相反,以太坊在过去一年中 DeFi 用户数量持续下降(从2023年2月20日的120,000 个地址下降了24%)。以太坊的活动和用户数量的更多细节将在下一部分进行讨论。
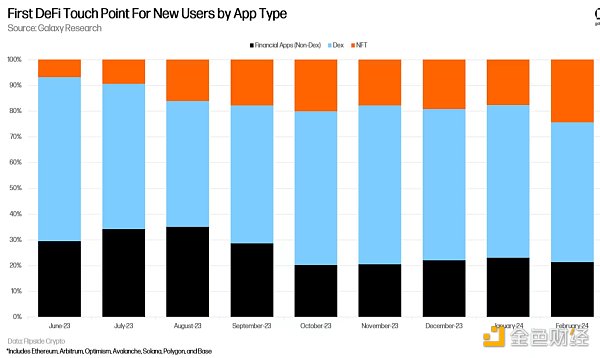
去中心化交易平台(Dexes)已经成为加入以上七条链的 DeFi 用户的关键组成部分。参考下面的图表,金融应用类别包括像借代平台和收益聚合器这样的应用。自2023年9月以来,几乎60%的所有新用户参与了这七条链上的 DeFi,其中大部分是从去中心化交易平台开始的。这与过去六个多月来围绕 DeFi 发生的空投和炒作浪潮是一致的。此外,请注意过去三个月内 NFT 在吸引新用户进入 DeFi 方面的日益突出。
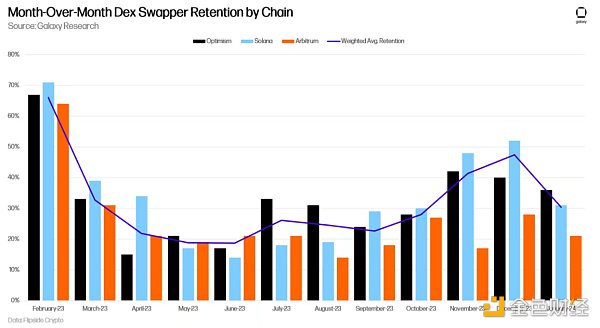
在进入1月之前的三个月中,去中心化交易平台(Dex)用户的留存率显著强劲。在过去五个月中观察到的链中,Solana 的 Dex 用户留存率最高,这可以归因于 Jupiter 的空投活动。下面的图表跟踪了 Solana、Arbitrum 和 Optimism 这三条链上 Dex 用户的月度留存率(用户在月份 x 加入并在月份 x + 1 仍在进行交易)。这些用户的月度留存率在连续四个月(Solana 的情况下为六个月)上升后,在2024年1月开始下降。加权平均留存率基于新的每月 Dex 用户。
3、以太坊和 Layer2
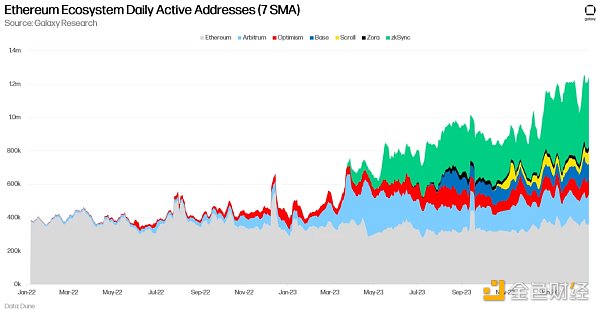
在加密货币 Twitter 上,以太坊因用户数量下降和整体活动减少而受到批评。虽然每日活跃地址数量和活动指标(如交易数量)在过去两年中大部分时间都保持平稳或略有下降,但以太坊致力于将未来发展重心放在 Rollup 上,因此仅通过其 L1 的视角来衡量以太坊是不公平的。考虑到一些顶级的 Layer 2(L2),以太坊的用户增长和活动量达到了历史最高水平。
下图显示了以太坊 L1 和一些主要 L2 的综合网络每日活跃地址。截至2月21日,这些网络总共拥有超过120万个每日活跃地址,其中以太坊 L1 仅占据了36万个地址。请注意,此图表仅包括部分以太坊 L2。
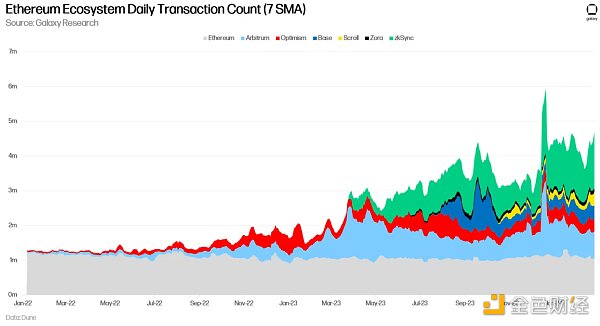
以太坊和同样的 Layer 2(L2)上的交易数量显示出类似的高水平。尽管以太坊 L1 的交易速度较慢,但截至2024年2月26日结束的30天内,其 L2 生态系统的平均每日交易量达到了314万笔。
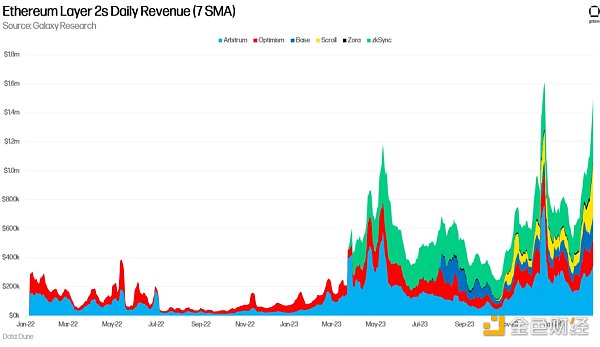
与强劲的交易数量相一致的是不断增长的收入。截至2024年2月26日,Arbitrum、Optimism、Base、Scroll、Zora 和 zkSync 使用7天简单移动平均线(SMA)每日产生150万美元的收入(这些是用户支付给 Rollup 排序器的费用)。2024年2月26日还标志着所观察到的链的第二高日收入。
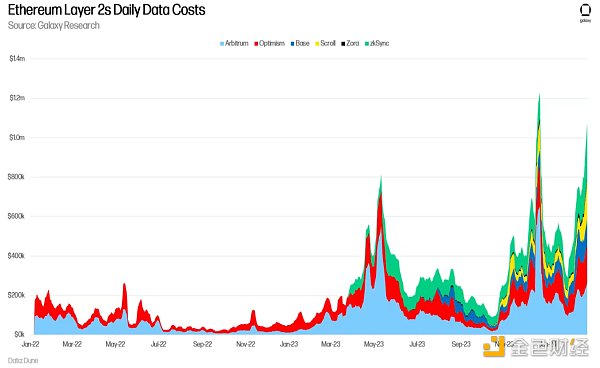
同样的 L2 在截至2024年2月26日结束的30天内向以太坊 L1 支付了超过2160万美元的数据成本。随着以前在以太坊 L1 上执行的活动转移到 Rollup 上,这个数字将变得越来越重要。
4、信号与要点
上述数据提供了一些关键信号:
1)对加密原生资产在 DeFi 中替代 RWAs 的持续需求迹象仍然持久存在。
2)尽管大规模空投已经结束,用户仍然涌入 DeFi,然而,去中心化交易平台的留存率在一月份下降。这表明在 DeFi 的这个领域中出现了一些用户的流失或投降。
3)尽管有人指出以太坊的活动量和用户数量下降,但其 Layer 2 生态系统仍然充满活力,交易数量接近历史最高水平。
By the end of 2008, many days have passed, and we have seen that the market value of asset securitization on the chain has reached a record high, and the number of participating addresses has reached a record high in some major markets for two years. The ecosystem of Ethereum is still active. This report highlights some key trends around the industry through the perspective of chain data. The main point is that the total market value on a monthly basis has reached a record high of about 100 million US dollars, and the financial asset market is treasury bonds and bonds. Private credit and real estate also reached a new high of US$ 100 million on January, although the market value reached this milestone, encrypted native assets are gaining market share in key areas, and the number of main and interactive addresses has reached the highest level in the past two years, reaching 10,000 addresses. Decentralized trading platform is one of the most common applications when users use it for the first time, and the number of daily active addresses in the Ethereum ecosystem and main areas has reached the highest level in history, and the number of daily transactions continues to climb. The income in the past month has also achieved substantial growth. The market value of real-world assets has reached a new historical high of $ billion. It is worth noting that financial assets, including treasury bonds and other bonds, private credit and real estate, also reached a new historical high of $ billion on. Please note that these values only take into account the value of the public blockchain itself, and do not include stable currencies or issuers such as and countries with financial assets as of. The proportion of debt and bonds has dropped by about basis points compared with the highest level in history. Although its market value has reached a new high in the chain, its dominant position and usage in the chain products are gradually weakening, which is most obvious in the mortgage. Since the end of last year, its usage has been steadily declining. This is a key sign that people prefer to use encrypted original assets in the chain instead of increasing the demand for encrypted currency, which has been further strengthened by the recent growth of stable currency. The trend is strong. In addition, the productivity of crypto-primary assets has surpassed that in some aspects, which we mentioned in the news briefing on March. Taking Hehe as an example, the stable rate of crypto-mortgage is higher than the stable rate. This trend still exists and becomes more obvious after voting to increase the stable rate of some collateral in its chain vaults. It is worth noting that it will increase the rate of casting through one of its vaults by basis points, which is also reflected in the relative supply of major stable coins. On the yield of national debt, the chart below shows the weighted average supply of the amount of loans across the sum. Since the end of the year and the beginning of the month, the yield of the stable currency has been higher than that of the one-month treasury bonds. Just before the collateral began to decline, the daily active addresses used by users and retention rates on the main sum reached an address on the day simple moving average, hitting a new two-year high on the day, month and day, and maintained the largest number of daily active addresses as of the day, month and day. On the contrary, the number of users of Ethereum has been declining in the past year, from the address of October to October. More details of the activities and the number of users of Ethereum will be discussed in the next part. Decentralized trading platform has become a key component of users joining the above seven chains. Refer to the chart below. Financial application categories include applications such as borrowing platform and income aggregator. Almost all new users have participated in these seven chains since October. Most of them started from the decentralized trading platform, which is consistent with the wave of airdrops and hype that has occurred in the past six months. In addition, please note that attracting new users has become increasingly prominent in the past three months. In the three months before entering the month, the user retention rate of decentralized trading platform is significantly strong, and the user retention rate in the chain observed in the past five months is the highest, which can be attributed to the airdrops. The chart below tracks the monthly retention of users in these three chains. The monthly retention rate of these users rose for six months after four consecutive months, and then began to decline in June. The weighted average retention rate is based on the new monthly user Ethereum and Ethereum on cryptocurrency, which has been criticized for the decline in the number of users and the overall activity. Although the number of daily active addresses and activity indicators such as the number of transactions have remained stable or slightly decreased for most of the past two years, Ethereum is committed to the future development. The focus of the exhibition is on the Internet, so it is unfair to measure Ethereum only from its perspective. Considering that the user growth and activity of some top Ethereum have reached the highest level in history, the following figure shows the daily active addresses of Ethereum and some major integrated networks. As of March, these networks have more than 10,000 daily active addresses, of which Ethereum only occupies 10,000 addresses. Please note that this chart only includes some Ethereum Ethereum and the same number of transactions on the Internet shows a similar high level. Although the transaction speed of Ethereum is slow, the average daily transaction volume of its ecosystem has reached 10,000 in the days ending on March, which is consistent with the strong transaction volume. As of March, and the day of use, the simple moving average generates 10,000 US dollars of income every day. These are the fees paid by users to the sorter, which also marks the second highest daily income of the observed chain. Similarly, the data cost of more than 10,000 US dollars has been paid to Ethereum in the days ending on March. This number will become more and more important as the activities previously carried out in the Ethereum are transferred to the world. The above data provide some key signals, and the signs of continuous demand for the replacement of encrypted native assets still persist. Although the large-scale airdrop has ended, users are still pouring in, but the retention rate of decentralized trading platforms declined in January, which shows that some users have lost or surrendered in this field. Although it is pointed out that the activity and number of users in Ethereum have decreased, its ecosystem is still full of vitality, and the number of transactions is close to the highest level in history. 比特币今日价格行情网_okx交易所app_永续合约_比特币怎么买卖交易_虚拟币交易所平台
注册有任何问题请添加 微信:MVIP619 拉你进入群

打开微信扫一扫
添加客服
进入交流群
1.本站遵循行业规范,任何转载的稿件都会明确标注作者和来源;2.本站的原创文章,请转载时务必注明文章作者和来源,不尊重原创的行为我们将追究责任;3.作者投稿可能会经我们编辑修改或补充。